Press "Enter" to skip to content

Month: November 2018

Prometheus中rate和irate的区别

rate()

rate(v range-vector) calculates the per-second average rate of increase of the time series in the range vector.

rate()函数计算某个时间序列范围内的每秒平均增长率。

Breaks in monotonicity (such as counter resets due to target restarts) are automatically adjusted for.

自适应单调性中断(比如target重启导致的计数器重置).

Also, the calculation extrapolates to the ends of the time range, allowing for missed scrapes or imperfect alignment of scrape cycles with the range’s time period.

计算结果是推算到每个时间范围的最后而得出, 允许漏抓和抓取周期与时间范围的不完美结合.

The following example expression returns the per-second rate of HTTP requests as measured over the last 5 minutes, per time series in the range vector:

以下示例返回最后五分钟HTTP请求每秒增长率

rate(http_requests_total{job="api-server"}[5m])

rate should only be used with counters. It is best suited for alerting, and for graphing of slow-moving counters.

rate应该只和计数器一起使用。最适合告警和缓慢计数器的绘图。

Leave a Comment

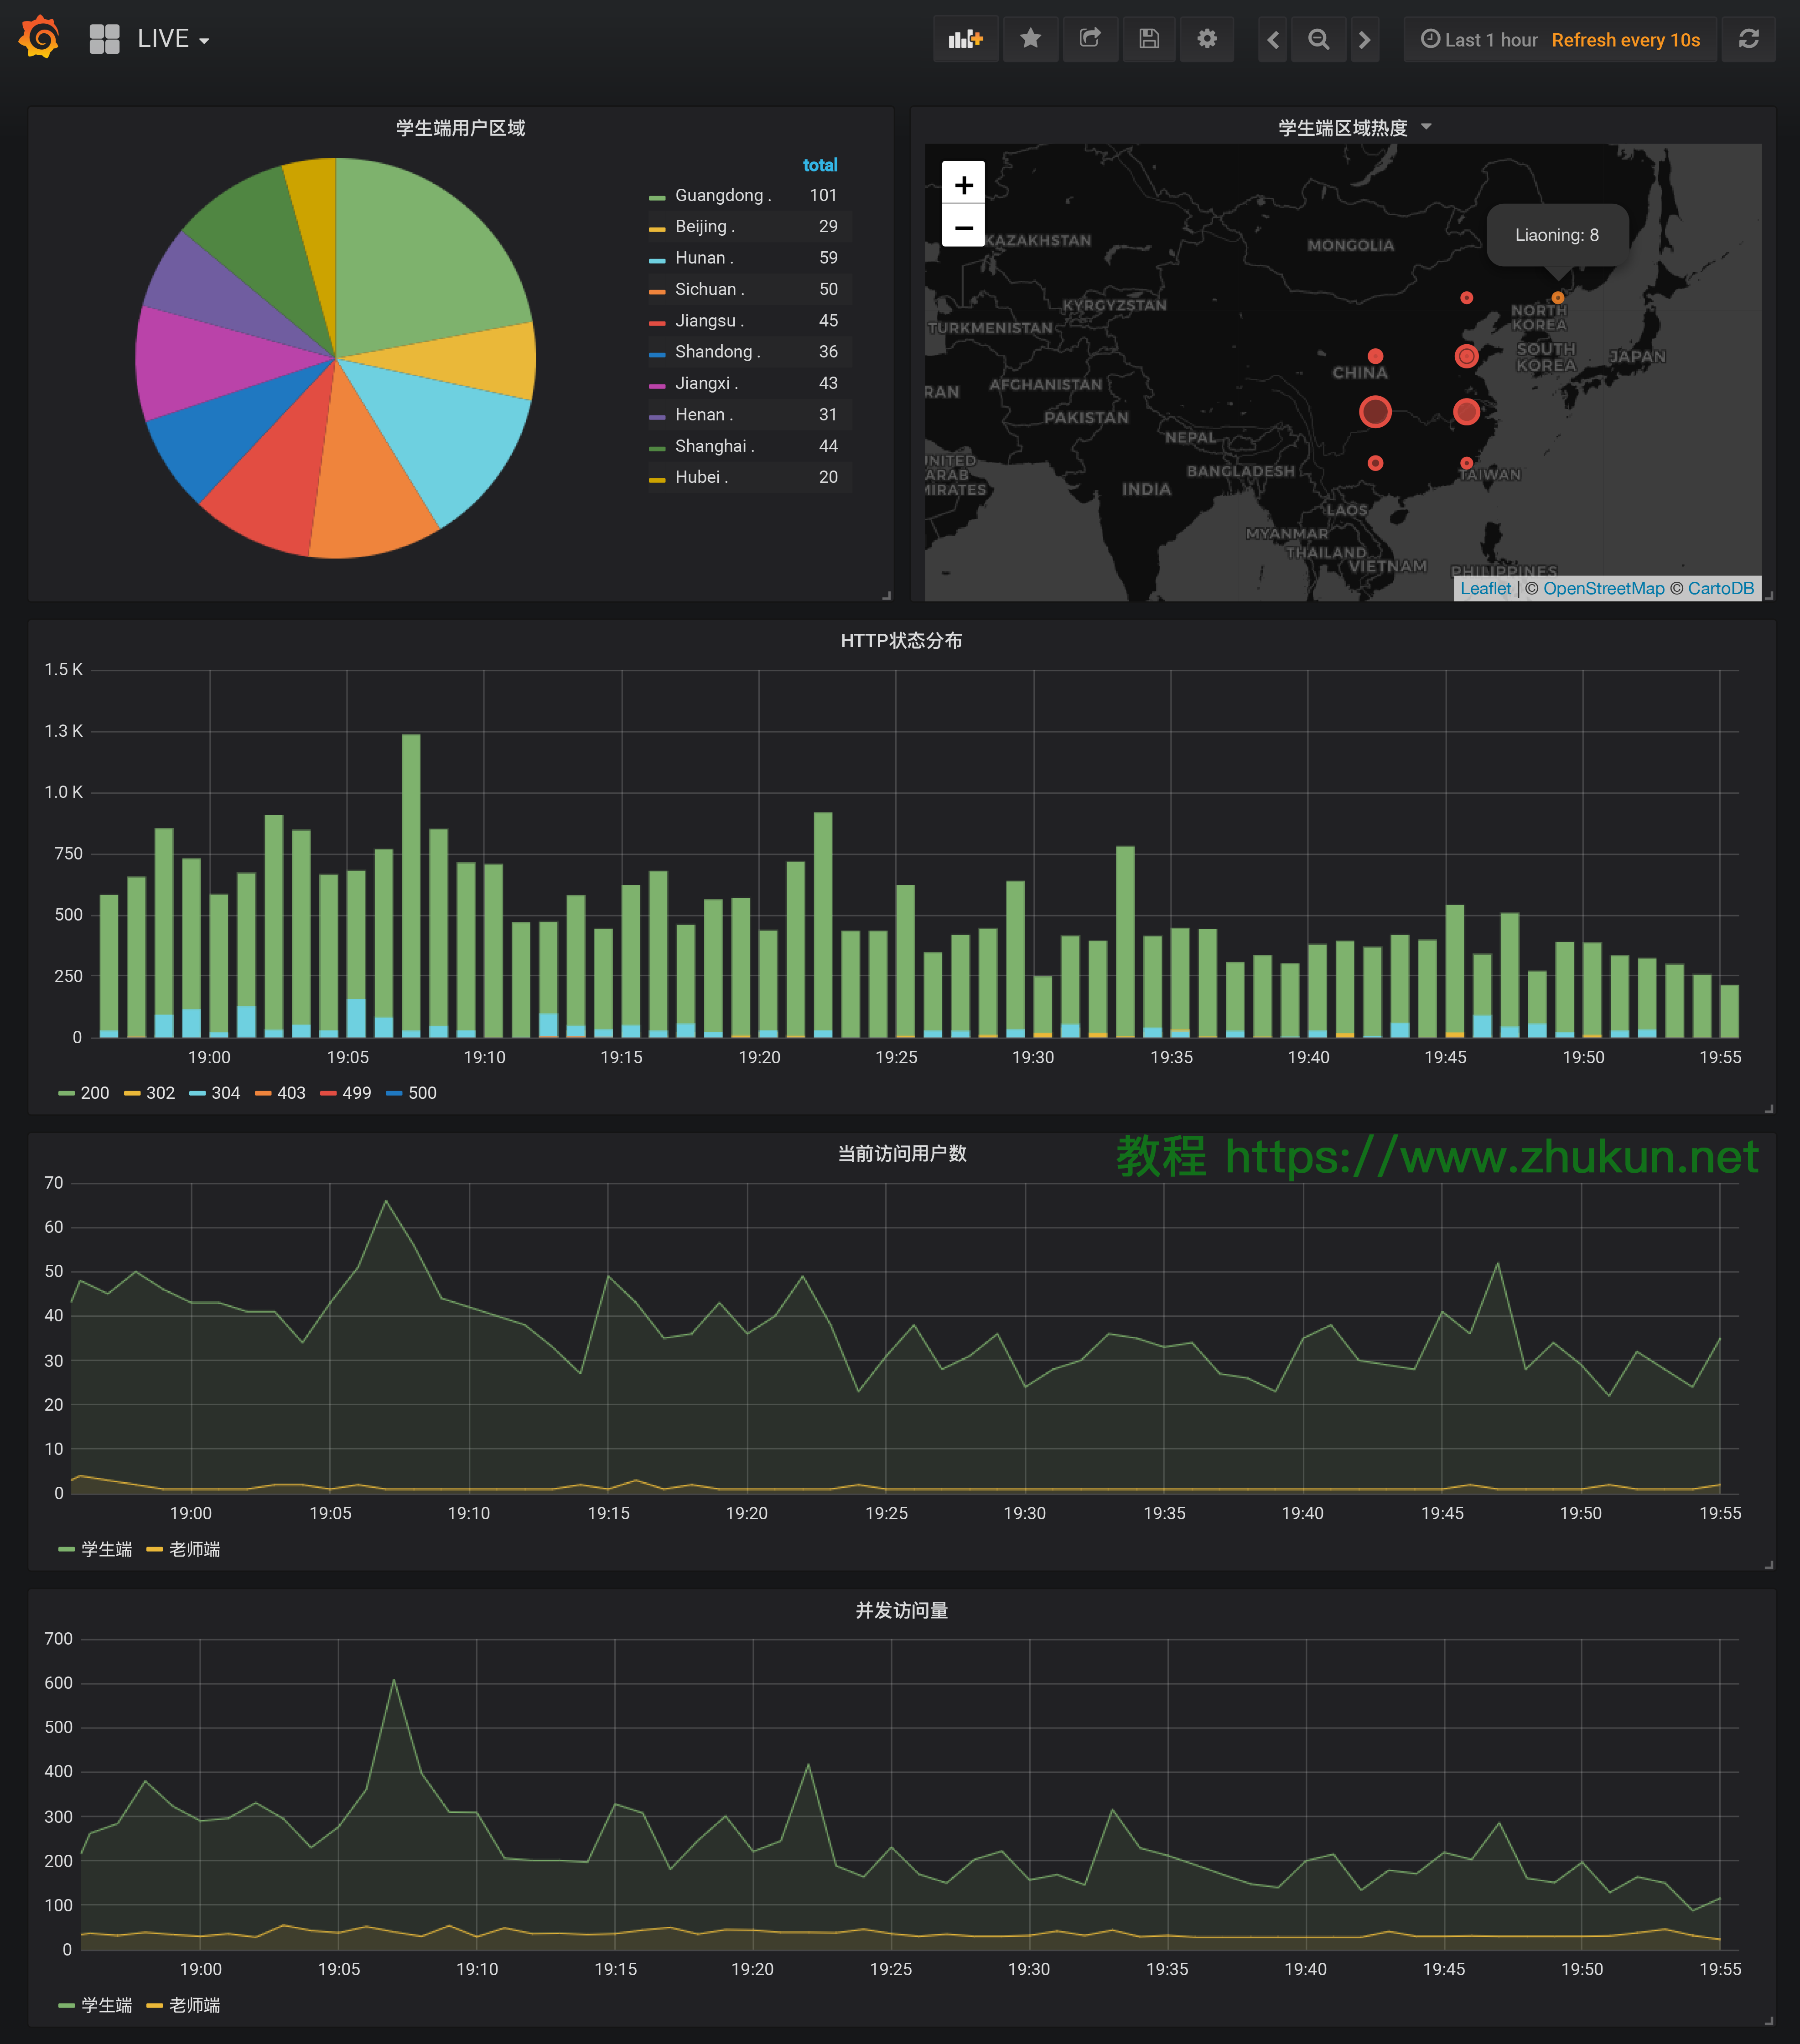
使用Collectd+Prometheus+Grafana监控nginx状态

在安装Nginx时,如果指定了–with-http_stub_status_module, 就可以使用本文的方法进行监控. 不用担心, 不论是从rpm/apt安装的Nginx, 均自带了该Module.

一般的建议是, 在nginx的机器上同时安装Collectd和collectd_exporter, 然后将数据导出到Prometheus(一般位于第三方服务器), 再从Grafana读取Prometheus中的数据.

1, 配置nginx

安装Nginx的过程此处略过, 我们需要确定一下Nginx安装了http_stub_status_module.

$ sudo nginx -V | grep http_sub_status
nginx version: nginx/1.14.0
built by gcc 4.8.5 20150623 (Red Hat 4.8.5-28) (GCC)
built with OpenSSL 1.0.2k-fips  26 Jan 2017
TLS SNI support enabled
configure arguments: --user=nginx --group=nginx --prefix=/usr/local/nginx --conf-path=...

配置Nginx启用该module

location /nginx_status {
    stub_status on;
    access_log off;
    allow 127.0.0.1;
    deny all;
}

然后便可以通过http://ip/nginx_status来获取相关状态信息.

$ curl http://127.0.0.1/nginx_status
Active connections: 29
server accepts handled requests
 17750380 17750380 6225361
Reading: 0 Writing: 1 Waiting: 28
Leave a Comment

nginx监控方案

官网介绍的监控方案:https://www.nginx.com/blog/monitoring-nginx/
Prometheus集成的HTTP exporter方案:https://prometheus.io/docs/instrumenting/exporters/#http

Leave a Comment

配置ELK系统(ElasticSearch+Logstash+Kibana)收集nginx系统日志(三): Logstash的Grok过滤器插件原理

Grok是Logstash最重要的插件, 可以将非结构化日志数据解析为结构化和可查询的内容.

此工具非常适用于syslog日志, apache和其他Web服务器日志, mysql日志, 以及通常为人类而非计算机使用而编写的任何日志格式.

grok的语法

%{SYNTAX:SEMANTIC}

SYNTAX是文本要匹配的”patterns”(翻译为”模式”, 但我觉得翻译成”类型”更恰当)
SEMANTIC是匹配到的文标识(字段), 默认是以字符串的方式保存

翻译成中文就是

%{模式:字段}

假设有以下日志片断

55.3.244.1 GET /index.html 15824 0.043

通过分析, 第一段可能是一个IP, 第二段可能是一个HTTP的请求方法, 第三段可能是请求的页面, 等等, 所以grok的过滤表达式可以写为

%{IP:client} %{WORD:method} %{URIPATHPARAM:request} %{NUMBER:bytes} %{NUMBER:duration}

经过grok过滤器处理以后, 该日志片断将被解析成以下字段

client: 55.3.244.1
method: GET
request: /index.html
bytes: 15824
duration: 0.043
Leave a Comment

配置ELK系统(ElasticSearch+Logstash+Kibana)收集nginx系统日志(二): 配置Kibana

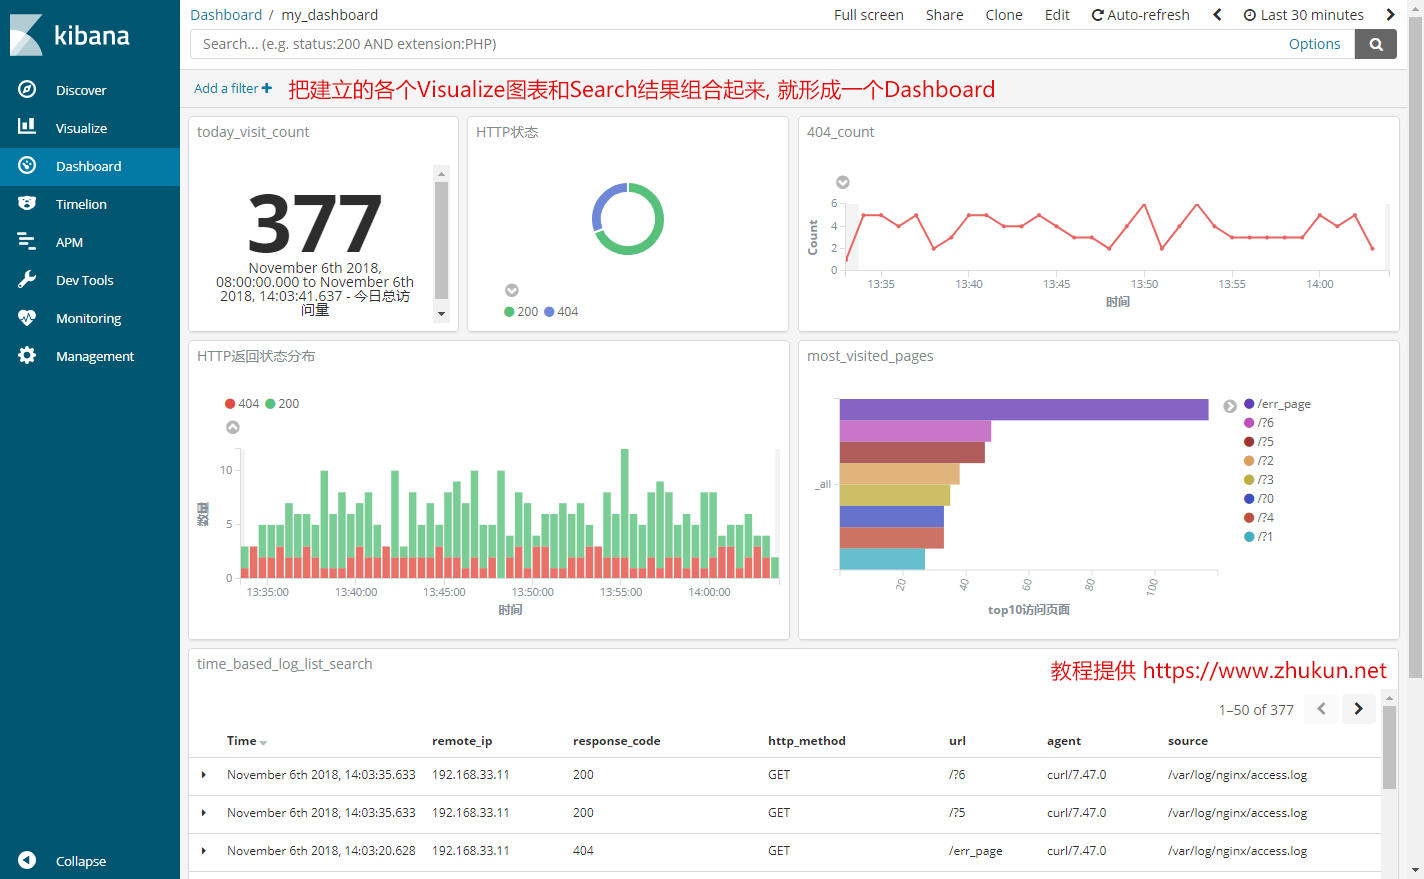
本文承接上一篇配置ELK系统(ElasticSearch+Logstash+Kibana)收集nginx系统日志(一), 主要演示Kibana的使用方法. 本文所有图片点击即可在新窗口查看大图.

Kibana是整个ELK系统里用于图形展示的环境, 通过Kibana我们可以建立各种生动的图表来展示日志文件中的数据, 例如下图:
配置Kibana

安装好Kibana以后, 首先是添加一个”Index Pattern”(索引模式), 这部分内容比较简单, 我们直接跳到Kibana的主界面上来说吧.

一, 原理解析

Kibana的主界面上主要有3个重要选项:
1, Discover: 这个界面默认展示ElasticSearch里面的存储的各字段, 及其数量. 此外, 还可以建立一个Search结果, 即把不需要的字段去掉, 仅展示我们想看见的字段. 见下图的演示

Leave a Comment