Press "Enter" to skip to content

11 search results for "prometheus"

Redis监控(Grafana+Prometheus+redis_exporter)

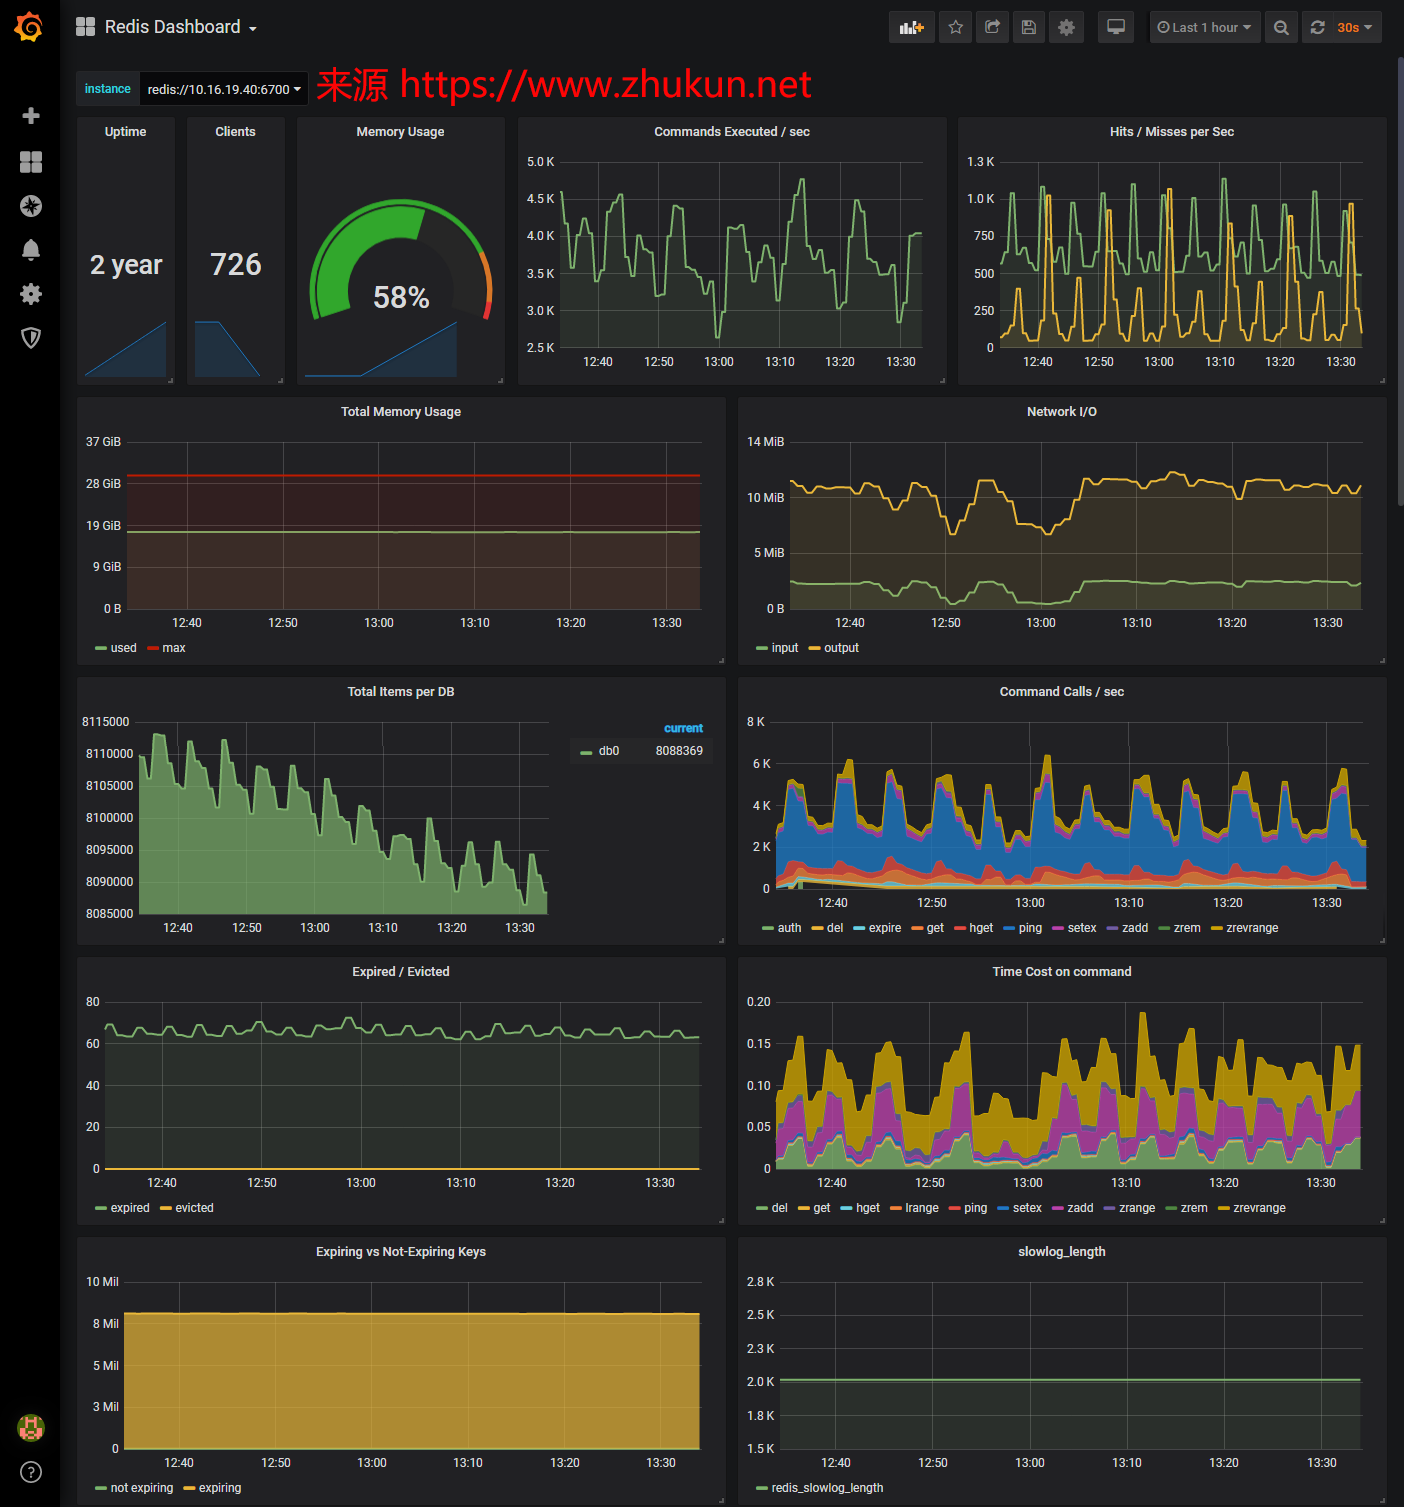
先看一下最终的效果图(本文中的图片均可以点击查看大图)
Redis监控(Grafana+Prometheus+redis_exporter)

环境准备

Promethus推荐的Exporter: https://prometheus.io/docs/instrumenting/exporters/

其推荐的是这个redis_exporter: https://github.com/oliver006/redis_exporter, 本文略过了Grafana+Prometheus+redis_exporter的安装过程, 我们假设redis_exporter的安装位置为/data/apps/redis_exporter/redis_exporter

查看每个机器上Redis的连接密码

$ grep requirepass /data/conf/redis/redis-670*.conf | grep -v '\#'

要监控的机器redis节点

此组redis密码:K8aBe56E         此组redis密码:uizJFaP9
10.16.19.37:6700              10.16.19.37:6703
10.16.19.37:6701              10.16.19.37:6704
10.16.19.37:6702              10.16.19.37:6705 
10.16.19.40:6700              10.16.19.40:6703
10.16.19.40:6701              10.16.19.40:6704
10.16.19.40:6702              10.16.19.40:6705
10.16.19.58:6700              10.16.19.58:6703
10.16.19.58:6701              10.16.19.58:6704
10.16.19.58:6702              10.16.19.58:6705
2 Comments

Prometheus的label处理

Prometheus能否在查询的时候对label进行2次处理呢?答案是可以的。Prometheus提供了一系列函数可以在Query的时候进行二次处理,本文要介绍的函数是label_replace()。

我们都知道,在 Prometheus 的配置文件里,不论targets里的ip是否带了:9100,最终形成的instance里面都会给你带上这个端口,形成像192.168.1.1:9100这样的格式。这个 instance本身就是一个 Prometheus 内置的label(这里指192.168.1.1:9100)。今天我们演示一下把讨厌的:9100去掉。

虽然我们也可以使用Variables功能来对instance进行正则化处理(如下图),但是处理以后的结果,在dashboard里面无法选中单个主机。因此这种方法是有bug的(不推荐使用)。

 使用Variables功能来对instance进行正则化处理
使用Variables功能来对instance进行正则化处理
Leave a Comment

Prometheus add custom exporter

Prometheus(中文名:普罗米修斯)是由SoundCloud开发的开源监控报警系统和时序列数据库(TSDB). 使用Go语言开发, 基本原理是通过HTTP协议周期性抓取被监控组件的状态. Prometheus获取数据的策略是Pull而不是Push, 也就是说, 它会自己去抓取, 而不用你来推送. 抓取使用的是HTTP协议, 在配置文件中指定目标程序的端口, 路径及间隔时间即可.

目前互联网公司常用的组件大部分都有exporter可以直接使用, 比如Varnish、Haproxy、Nginx、MySQL、Linux系统信息(包括磁盘、内存、CPU、网络等等).

当Prometheus的node_exporter中没有我们需要的一些监控项时,就可以如zabbix一样添加一些自定义的metrics,让其支持我们所需要的监控项。node_exporter 可在启动时指定路径,并将该路径下的 *.prom 识别为监控数据文件。

准备获取metrics的脚本

$ cat /opt/monitor/get_info.sh
#! /bin/bash

echo Logical_CPU_core_total  `cat /proc/cpuinfo| grep processor| wc -l`
echo logined_users_total     `who | wc -l`;
echo procs_total `ps aux|wc -l`
echo procs_zombie       `ps axo pid=,stat=|grep Z|wc -l`

测试脚本执行情况

$ bash get_info.sh
Logical_CPU_core_total 2
logined_users_total 1
procs_total 148
procs_zombie 0

设置定时任务

* * * * * bash /opt/monitor/get_info.sh > /opt/monitor/get_info.prom

启动 node_exporter

启动 node_exporter 时指定*.prom 数据文件的路径

./node_exporter --collector.textfile.directory=/opt/monitor/

验证metrics

$ curl 127.0.0.1:9100/metrics|grep -E Logical_CPU_core_total|logined_users_total|procs_total|procs_zombie
# TYPE Logical_CPU_core_total untyped
Logical_CPU_core_total 2
# HELP logined_users_total Metric read from /opt/monitor/get_info.prom
# TYPE logined_users_total untyped
logined_users_total 1
# HELP procs_total Metric read from /opt/monitor/get_info.prom
# TYPE procs_total untyped
procs_total 151
# HELP procs_zombie Metric read from /opt/monitor/get_info.prom
# TYPE procs_zombie untyped
procs_zombie 0

参考文档:
Prometheus 自定义exporter 监控key

Leave a Comment

Prometheus中rate和irate的区别

rate()

rate(v range-vector) calculates the per-second average rate of increase of the time series in the range vector.

rate()函数计算某个时间序列范围内的每秒平均增长率。

Breaks in monotonicity (such as counter resets due to target restarts) are automatically adjusted for.

自适应单调性中断(比如target重启导致的计数器重置).

Also, the calculation extrapolates to the ends of the time range, allowing for missed scrapes or imperfect alignment of scrape cycles with the range’s time period.

计算结果是推算到每个时间范围的最后而得出, 允许漏抓和抓取周期与时间范围的不完美结合.

The following example expression returns the per-second rate of HTTP requests as measured over the last 5 minutes, per time series in the range vector:

以下示例返回最后五分钟HTTP请求每秒增长率

rate(http_requests_total{job="api-server"}[5m])

rate should only be used with counters. It is best suited for alerting, and for graphing of slow-moving counters.

rate应该只和计数器一起使用。最适合告警和缓慢计数器的绘图。

Leave a Comment

使用Collectd+Prometheus+Grafana监控nginx状态

在安装Nginx时,如果指定了–with-http_stub_status_module, 就可以使用本文的方法进行监控. 不用担心, 不论是从rpm/apt安装的Nginx, 均自带了该Module.

一般的建议是, 在nginx的机器上同时安装Collectd和collectd_exporter, 然后将数据导出到Prometheus(一般位于第三方服务器), 再从Grafana读取Prometheus中的数据.

1, 配置nginx

安装Nginx的过程此处略过, 我们需要确定一下Nginx安装了http_stub_status_module.

$ sudo nginx -V | grep http_sub_status
nginx version: nginx/1.14.0
built by gcc 4.8.5 20150623 (Red Hat 4.8.5-28) (GCC)
built with OpenSSL 1.0.2k-fips  26 Jan 2017
TLS SNI support enabled
configure arguments: --user=nginx --group=nginx --prefix=/usr/local/nginx --conf-path=...

配置Nginx启用该module

location /nginx_status {
    stub_status on;
    access_log off;
    allow 127.0.0.1;
    deny all;
}

然后便可以通过http://ip/nginx_status来获取相关状态信息.

$ curl http://127.0.0.1/nginx_status
Active connections: 29
server accepts handled requests
 17750380 17750380 6225361
Reading: 0 Writing: 1 Waiting: 28
Leave a Comment

使用Prometheus和Grafana构建集群监控系统(三): 一些metric的计算语句

本文可能不定期更新.

1, node exporter的一些计算语句

CPU使用率(单位为percent)
100 - (avg by (instance) (irate(node_cpu_seconds_total{mode="idle"}[5m])) * 100)

内存已使用(单位为bytes)
node_memory_MemTotal_bytes - node_memory_MemFree_bytes - node_memory_Cached_bytes - node_memory_Buffers_bytes - node_memory_Slab_bytes

内存使用量(单位为bytes/sec)
node_memory_MemTotal_bytes - node_memory_MemFree_bytes - node_memory_Cached_bytes - node_memory_Buffers_bytes - node_memory_Slab_bytes

内存使用率(单位为percent)
((node_memory_MemTotal_bytes - node_memory_MemFree_bytes - node_memory_Cached_bytes - node_memory_Buffers_bytes - node_memory_Slab_bytes)/node_memory_MemTotal_bytes) * 100

server1的内存使用率(单位为percent)
((node_memory_MemTotal_bytes{instance="server1"} - node_memory_MemAvailable_bytes{instance="server1"})/node_memory_MemTotal_bytes{instance="server1"}) * 100

server2的磁盘使用率(单位为percent)
((node_filesystem_size_bytes{fstype=~"xfs|ext4",instance="server2"} - node_filesystem_free_bytes{fstype=~"xfs|ext4",instance="server2"}) / node_filesystem_size_bytes{fstype=~"xfs|ext4",instance="server2"}) * 100

uptime时间(单位为seconds)
time() - node_boot_time

server1的uptime时间(单位为seconds)
time() - node_boot_time_seconds{instance="server1"}

网络流出量(单位为bytes/sec)
irate(node_network_transmit_bytes_total{device!~"lo|bond[0-9]|cbr[0-9]|veth.*"}[5m]) > 0

server1的网络流出量(单位为bytes/sec)
irate(node_network_transmit_bytes_total{instance="server1", device!~"lo|bond[0-9]|cbr[0-9]|veth.*"}[5m]) > 0

网络流入量(单位为bytes/sec)
irate(node_network_receive_bytes_total{device!~"lo|bond[0-9]|cbr[0-9]|veth.*"}[5m]) > 0

server1的网络流入量(单位为bytes/sec)
irate(node_network_receive_bytes_total{instance="server1", device!~"lo|bond[0-9]|cbr[0-9]|veth.*"}[5m]) > 0

磁盘读取速度(单位为bytes/sec)
irate(node_disk_read_bytes_total{device=~"sd.*"}[5m])
Leave a Comment

使用Prometheus和Grafana构建集群监控系统(二): 定制Grafana展示界面

本文承接上一篇使用Prometheus和Grafana构建集群监控系统(一): 配置与搭建, 将演示一下如何在Grafana中定制一个好看的界面, 最终形成的界面如下图(点击图片查看大图):
定制Grafana展示界面

好了, 接下来开始我们的Grafana界面定制过程吧.

先添加一个Dashboard
定制Grafana展示界面

Leave a Comment

Can't find what you're looking for? Try refining your search: