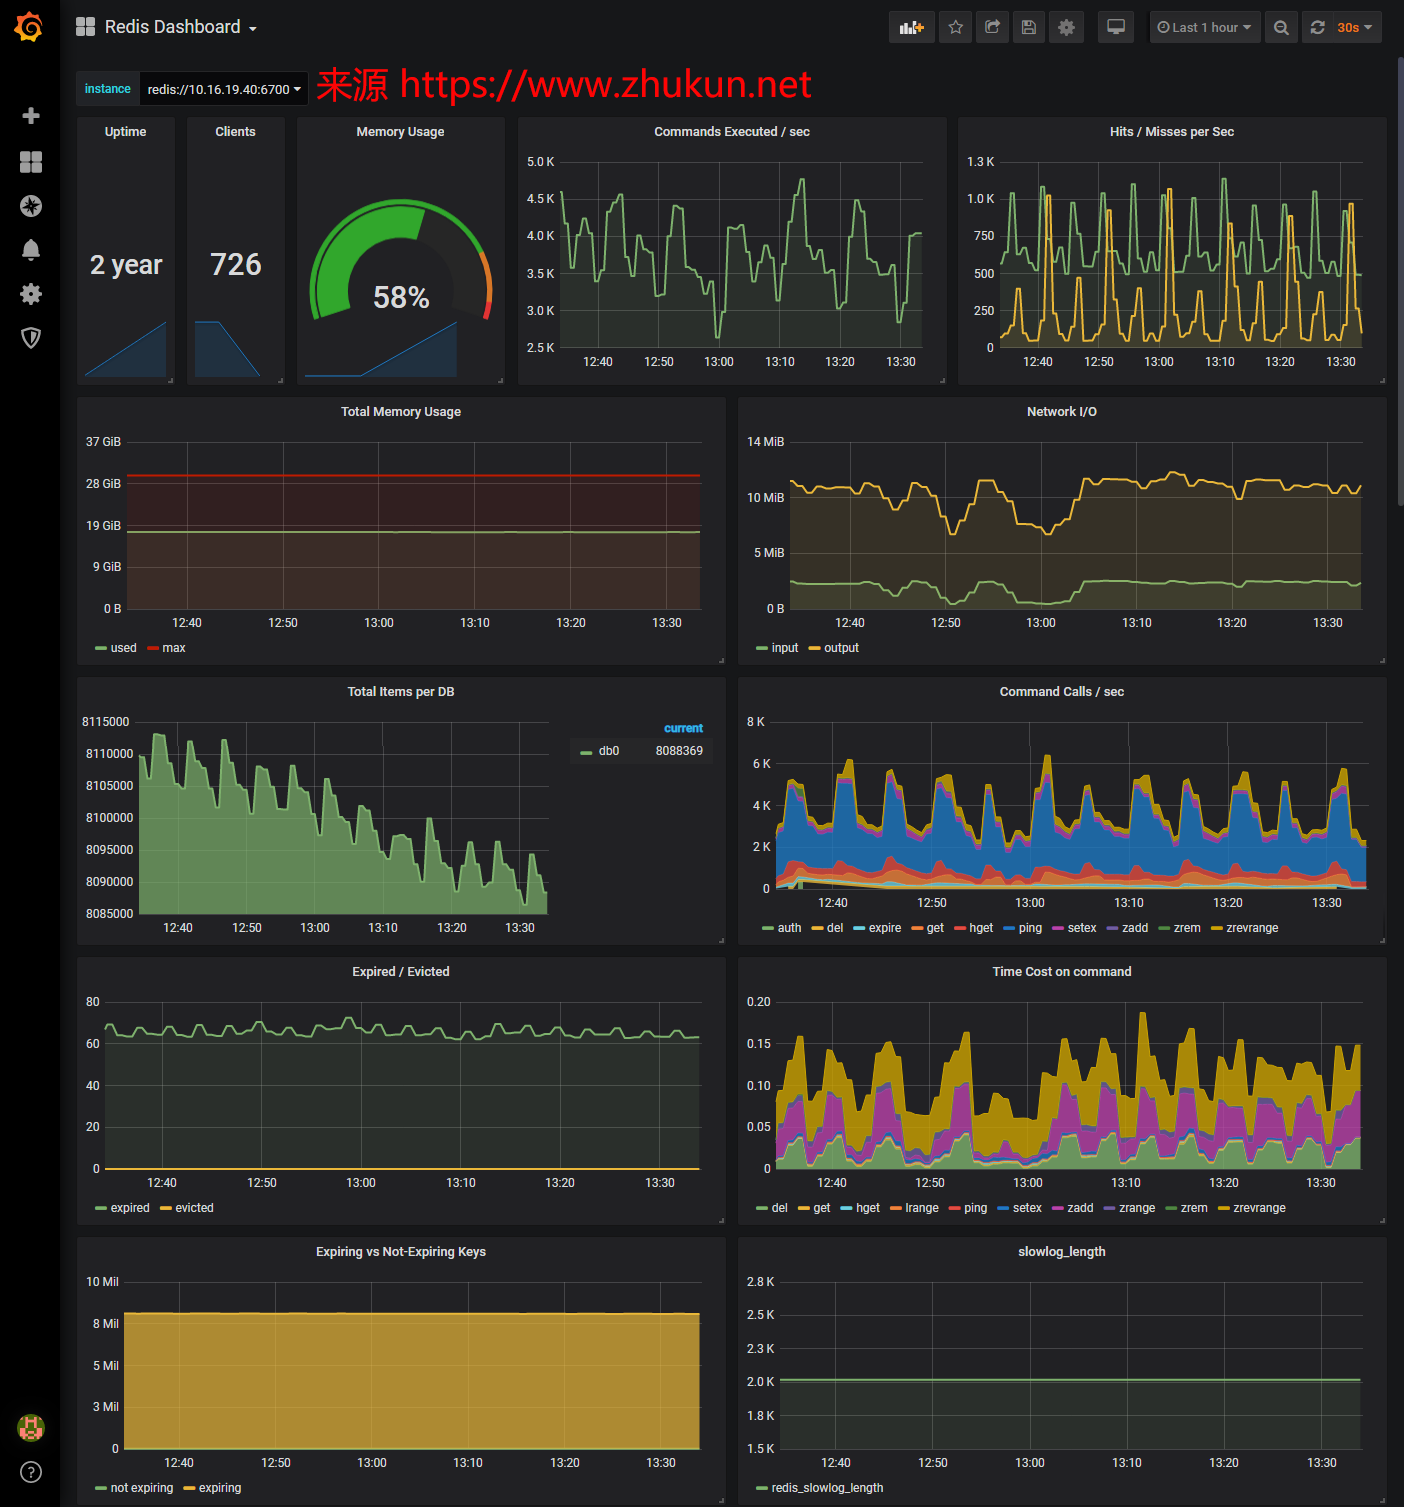
先看一下最终的效果图(本文中的图片均可以点击查看大图)
环境准备
Promethus推荐的Exporter: https://prometheus.io/docs/instrumenting/exporters/
其推荐的是这个redis_exporter: https://github.com/oliver006/redis_exporter, 本文略过了Grafana+Prometheus+redis_exporter的安装过程, 我们假设redis_exporter的安装位置为/data/apps/redis_exporter/redis_exporter
查看每个机器上Redis的连接密码
$ grep requirepass /data/conf/redis/redis-670*.conf | grep -v '\#'
要监控的机器redis节点
此组redis密码:K8aBe56E         此组redis密码:uizJFaP9
10.16.19.37:6700              10.16.19.37:6703
10.16.19.37:6701              10.16.19.37:6704
10.16.19.37:6702              10.16.19.37:6705
10.16.19.40:6700              10.16.19.40:6703
10.16.19.40:6701              10.16.19.40:6704
10.16.19.40:6702              10.16.19.40:6705
10.16.19.58:6700              10.16.19.58:6703
10.16.19.58:6701              10.16.19.58:6704
10.16.19.58:6702              10.16.19.58:6705
启动redis_exporter
在任意一台机器上运行redis_exporter就行了(因为它们可以靠IP连接), 假设我们在10.16.19.40上运行了redis_exporter(由于2组redis用了不同的密码, 因此需要启动2个redis_exporter)
$ nohup /data/apps/redis_exporter/redis_exporter --redis.password=uizJFaP9 --web.listen-address=:56800 2>&1 &
$ nohup /data/apps/redis_exporter/redis_exporter --redis.password=K8aBe56E --web.listen-address=:56801 2>&1 &
配置prometheus
$ vim /data/apps/prometheus/redis.yml
scrape_configs:
  - job_name: 'team-1'
    static_configs:
      - targets:
        - redis://10.16.19.37:6703
        - redis://10.16.19.37:6704
        - redis://10.16.19.37:6705
        - redis://10.16.19.40:6703
        - redis://10.16.19.40:6704
        - redis://10.16.19.40:6705
        - redis://10.16.19.58:6703
        - redis://10.16.19.58:6704
        - redis://10.16.19.58:6705
        labels:
          env: BJteam
          service: engine
    metrics_path: /scrape
    relabel_configs:
      - source_labels: [__address__]
        target_label: __param_target
      - source_labels: [__param_target]
        target_label: instance
      - target_label: __address__
        replacement: 10.16.19.40:56800

  - job_name: 'team-2'
    static_configs:
      - targets:
        - redis://10.16.19.37:6700
        - redis://10.16.19.37:6701
        - redis://10.16.19.37:6702
        - redis://10.16.19.40:6700
        - redis://10.16.19.40:6701
        - redis://10.16.19.40:6702
        - redis://10.16.19.58:6700
        - redis://10.16.19.58:6701
        - redis://10.16.19.58:6702
        labels:
          env: BJteam
          service: engine
    metrics_path: /scrape
    relabel_configs:
      - source_labels: [__address__]
        target_label: __param_target
      - source_labels: [__param_target]
        target_label: instance
      - target_label: __address__
        replacement: 10.16.19.40:56801
启动Promethus
$ vim /etc/systemd/system/prometheus_redis.service  # 写入如下内容

[Unit]
Description=prometheus_redis
After=network.target
[Service]
Type=simple
User=root
ExecStart=/data/apps/prometheus/prometheus --config.file=/data/apps/prometheus/redis.yml --storage.tsdb.path=/data/apps/prometheus/redis_tsdb/ --web.listen-address=0.0.0.0:9092 --storage.tsdb.retention.time=30d --web.enable-admin-api
Restart=on-failure
[Install]
WantedBy=multi-user.target
$ systemctl restart prometheus_redis
$ systemctl status prometheus_redis
$ systemctl enable prometheus_redis
确认监控Metric正常:
$ curl http://10.16.19.40:56800/scrape?target=redis://10.16.19.37:6700
......
# HELP redis_commands_duration_seconds_total Total amount of time in seconds spent per command
# 提示: redis_commands_duration_seconds_total表示执行每种命令所花费的总时间(秒)
redis_commands_duration_seconds_total{cmd="command"} 0.002261
redis_commands_duration_seconds_total{cmd="config"} 0.070622
redis_commands_duration_seconds_total{cmd="evalsha"} 74.839118
redis_commands_duration_seconds_total{cmd="get"} 12.943131
redis_commands_duration_seconds_total{cmd="incrby"} 6.023572
redis_commands_duration_seconds_total{cmd="info"} 0.115028
redis_commands_duration_seconds_total{cmd="keys"} 0.000274
redis_commands_duration_seconds_total{cmd="latency"} 0.001811
redis_commands_duration_seconds_total{cmd="ping"} 17.288006
redis_commands_duration_seconds_total{cmd="script"} 0.003994
redis_commands_duration_seconds_total{cmd="set"} 0.000566
redis_commands_duration_seconds_total{cmd="setex"} 8e-06
redis_commands_duration_seconds_total{cmd="slowlog"} 0.007638
# HELP redis_commands_processed_total commands_processed_total metric
# TYPE redis_commands_processed_total counter
redis_commands_processed_total 5.0632599e+07
# HELP redis_commands_total Total number of calls per command
# 提示: redis_commands_total表示执行每种命令的数量
redis_commands_total{cmd="command"} 2
redis_commands_total{cmd="config"} 791
redis_commands_total{cmd="evalsha"} 1.640119e+06
redis_commands_total{cmd="get"} 9.497393e+06
redis_commands_total{cmd="incrby"} 2.93687e+06
redis_commands_total{cmd="info"} 790
redis_commands_total{cmd="keys"} 9
redis_commands_total{cmd="latency"} 790
redis_commands_total{cmd="ping"} 3.6553714e+07
redis_commands_total{cmd="script"} 287
redis_commands_total{cmd="set"} 253
redis_commands_total{cmd="setex"} 1
redis_commands_total{cmd="slowlog"} 1580
......
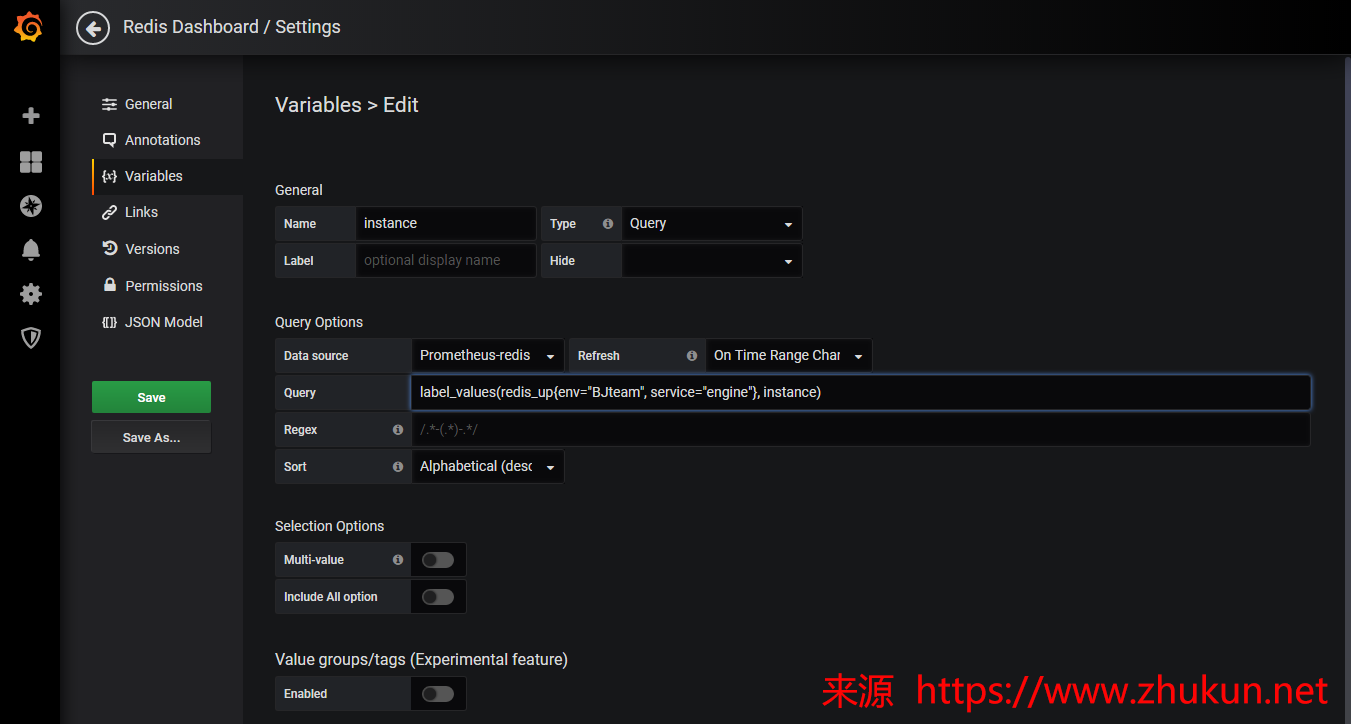
设置 Grafana
首先在Dashboard中添加一个Variable, Name为instance, Type选择Query, Query语句为
label_values(redis_up{env="BJteam", service="engine"}, instance)
然后就可以添加监控报表了. 一些Metric的计算语句如下
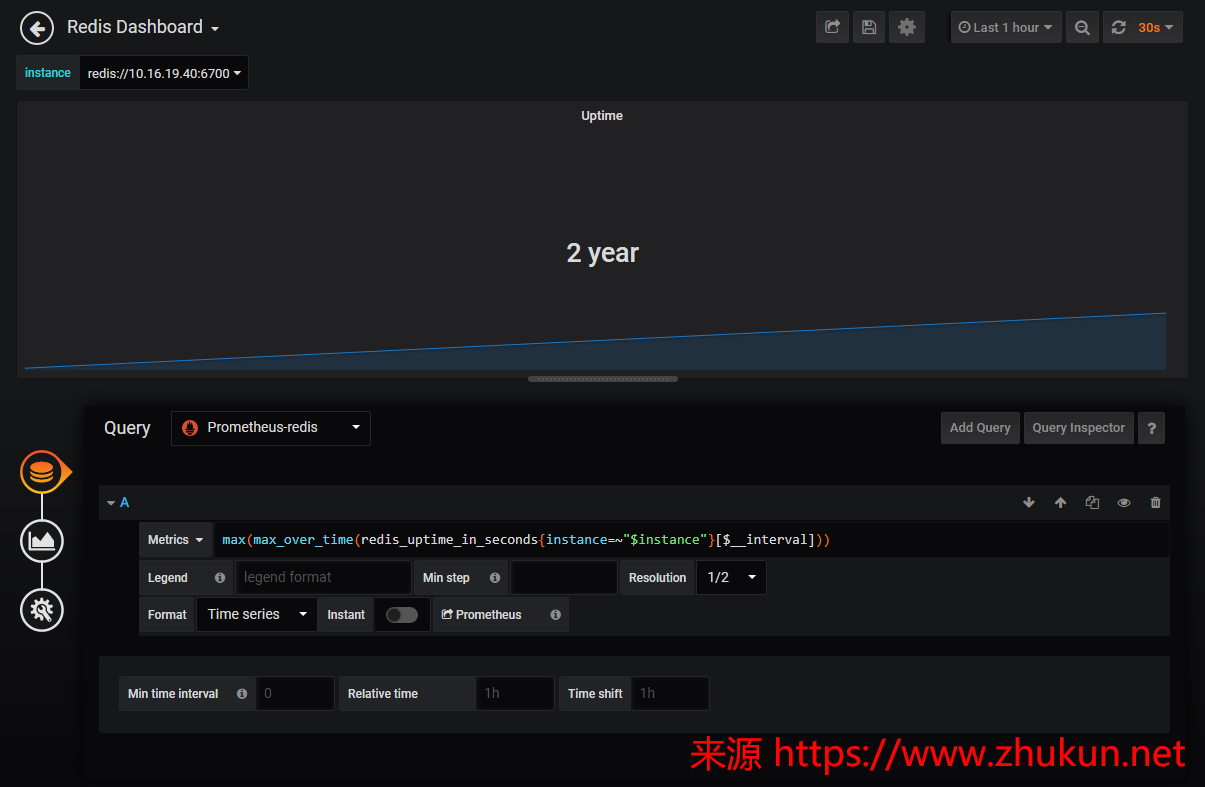
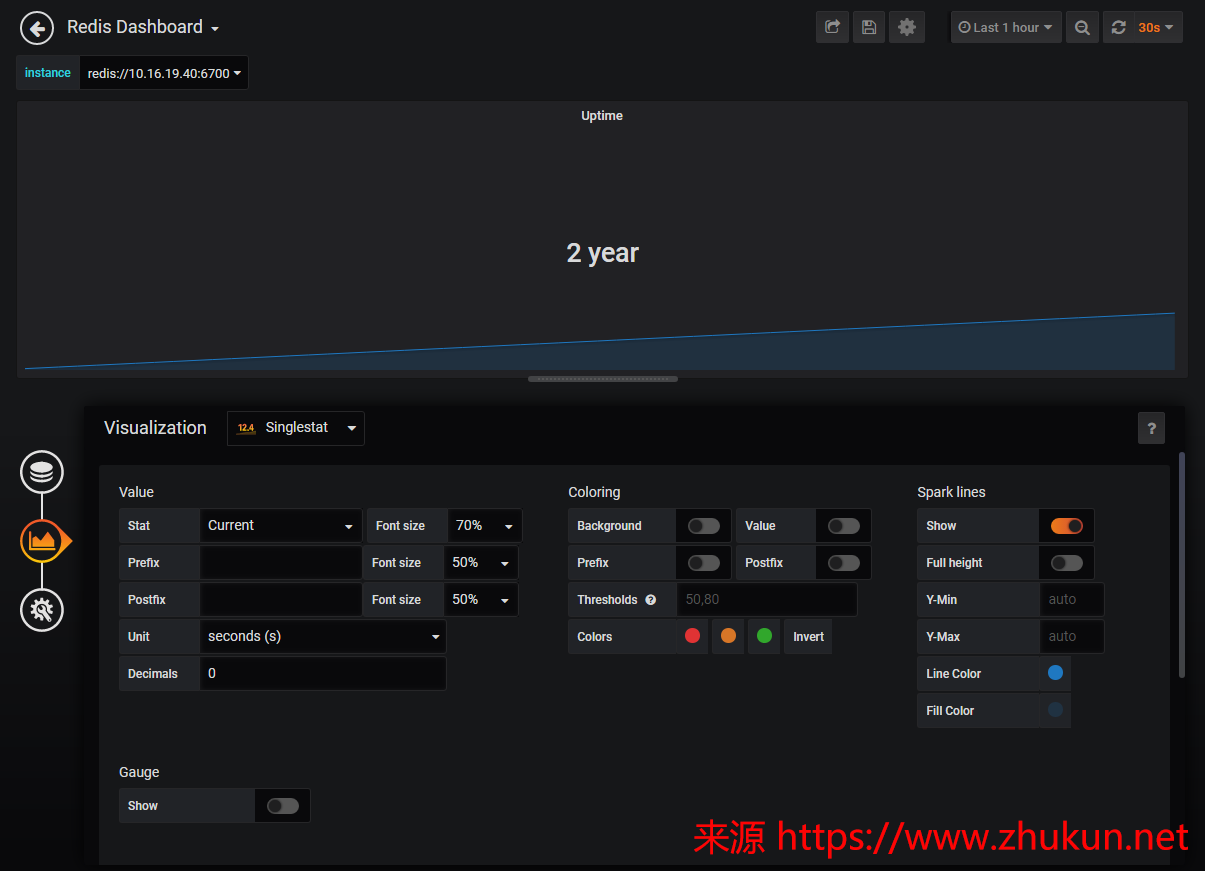
uptime时间 使用Singlestat面板 max(max_over_time(redis_uptime_in_seconds{instance=~"$instance"}[$__interval]))
clients数量 使用Singlestat面板 redis_connected_clients{instance=~"$instance"}
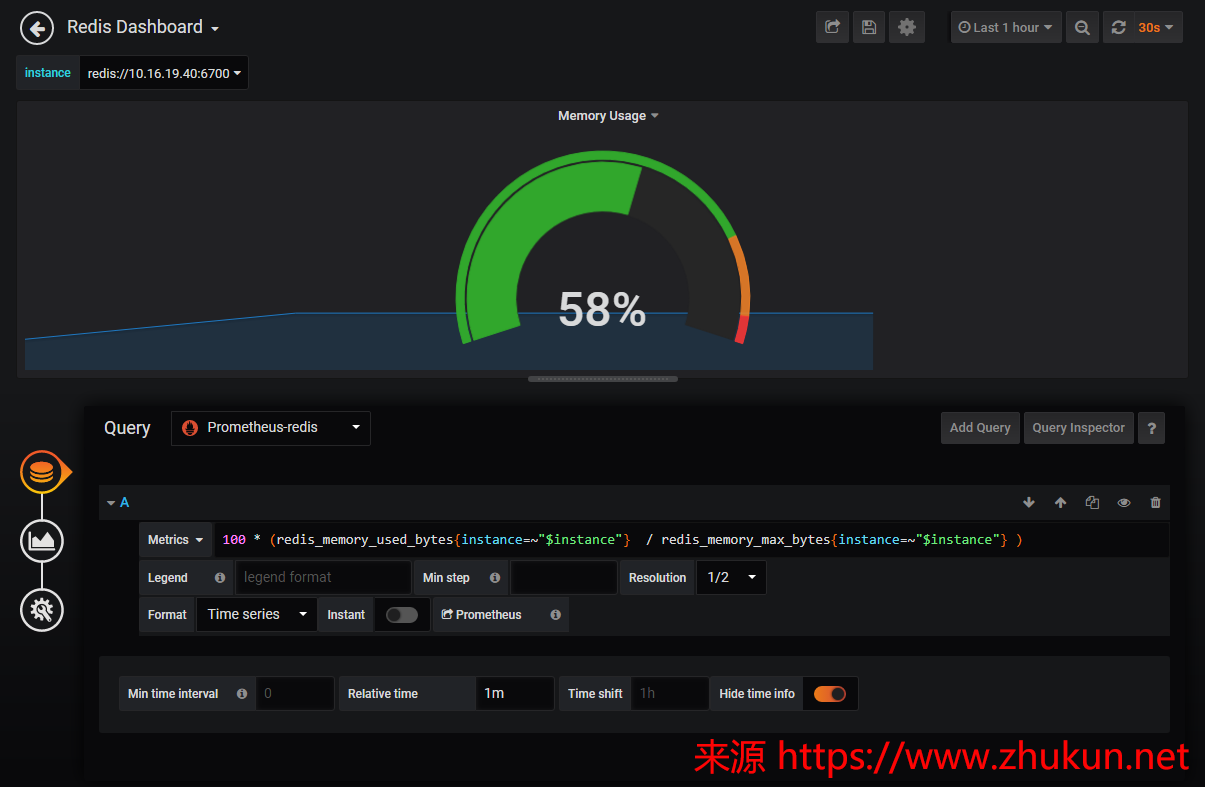
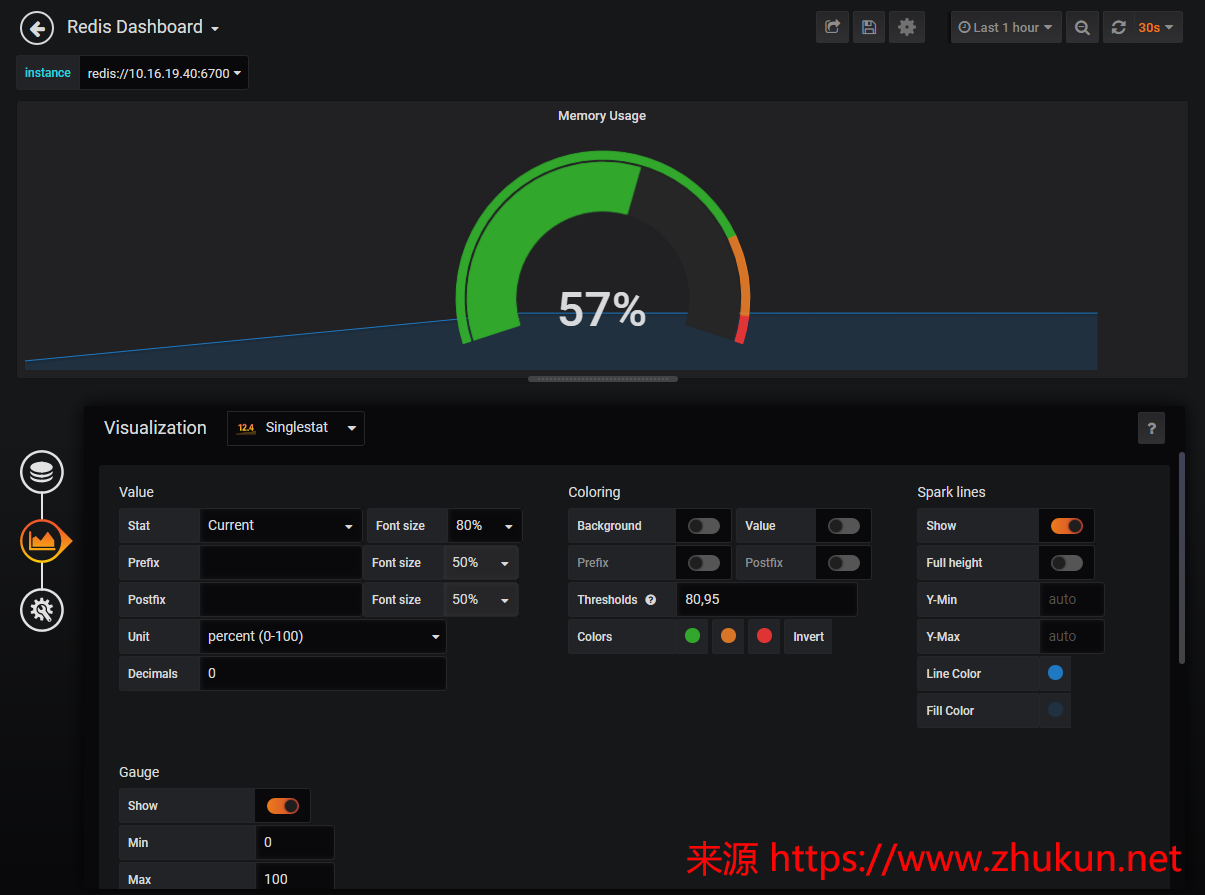
内存使用(百分比) 使用Singlestat面板 100 * (redis_memory_used_bytes{instance=~"$instance"} / redis_memory_max_bytes{instance=~"$instance"} )
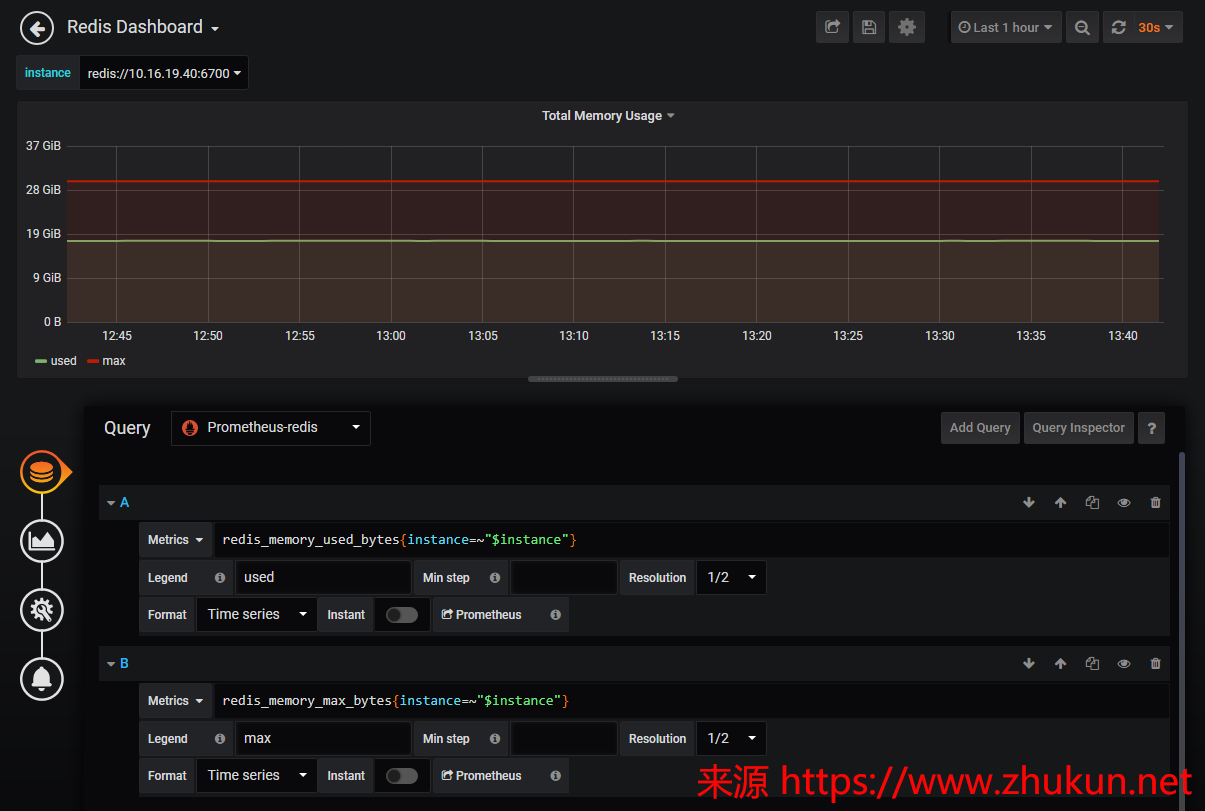
已使用内存 使用Graph面板 redis_memory_used_bytes{instance=~"$instance"}
最大内存 使用Graph面板 redis_memory_max_bytes{instance=~"$instance"}
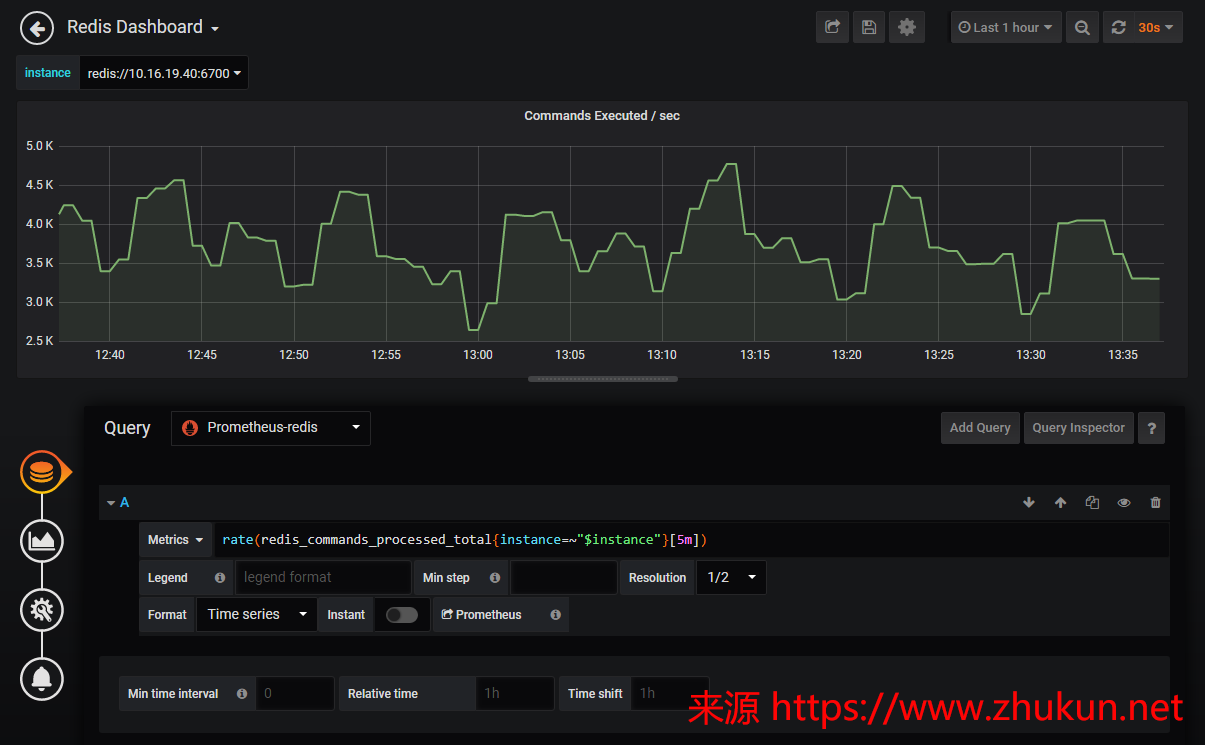
Commands Executed/Sec 使用Graph面板 rate(redis_commands_processed_total{instance=~"$instance"}[5m])
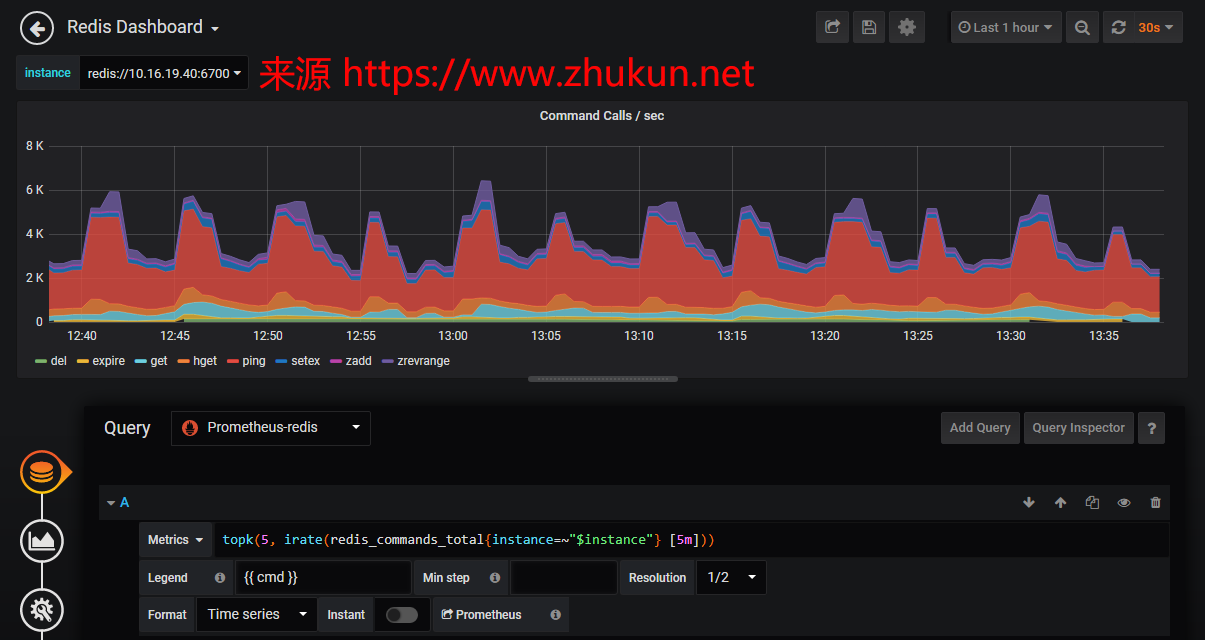
Commands Calls/Sec 使用Graph面板 topk(5, irate(redis_commands_total{instance=~"$instance"} [5m])) Legend选择{{ cmd }}
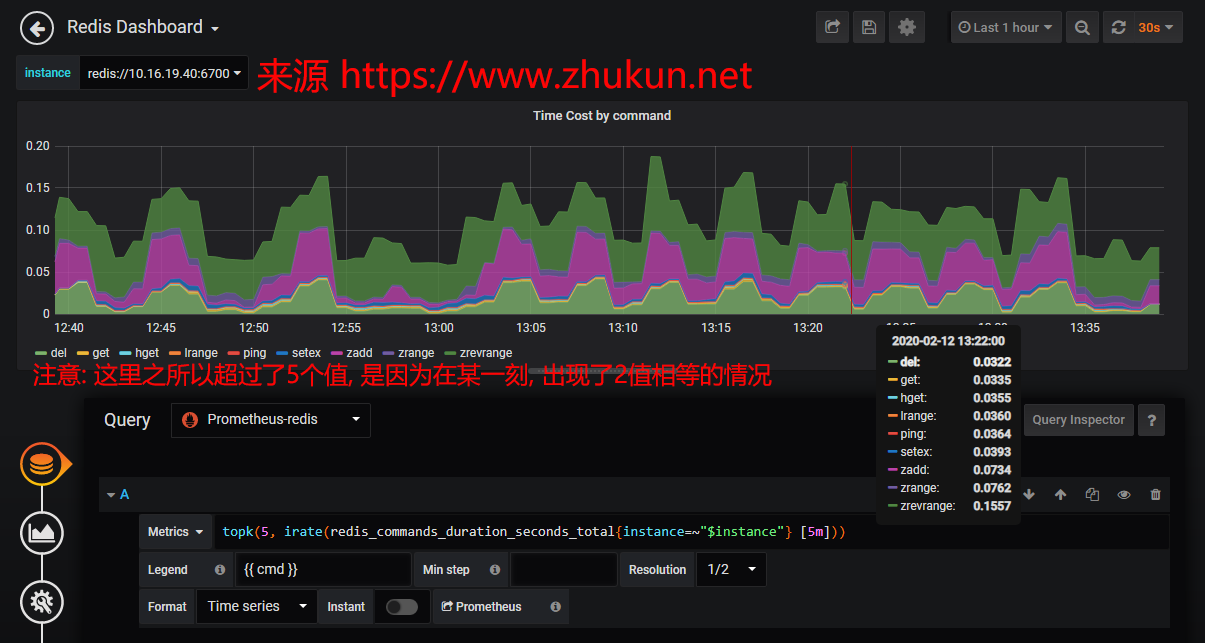
Time Cost by command 使用Graph面板 topk(5, irate(redis_commands_duration_seconds_total{instance=~"$instance"} [5m])) Legend选择{{ cmd }}
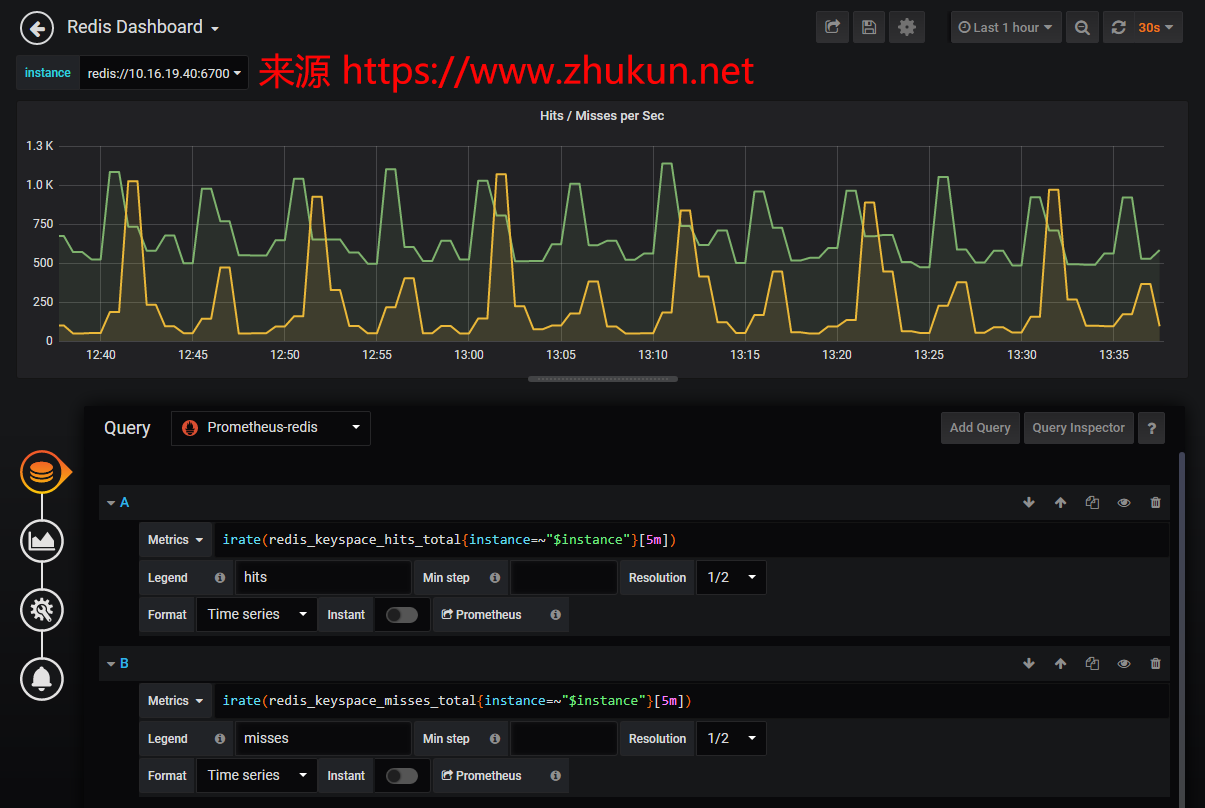
Hits/Sec 使用Graph面板 irate(redis_keyspace_hits_total{instance=~"$instance"}[5m])
Misses/Sec 使用Graph面板 irate(redis_keyspace_misses_total{instance=~"$instance"}[5m])
Key数量 使用Graph面板 sum (redis_db_keys{instance=~"$instance"}) by (db)
expired keys 使用Graph面板 sum(rate(redis_expired_keys_total{instance=~"$instance"}[5m])) by (instance)
evicted keys 使用Graph面板 sum(rate(redis_evicted_keys_total{instance=~"$instance"}[5m])) by (instance)
slowlog_ length 使用Graph面板 redis_slowlog_length{instance=~"$instance"}
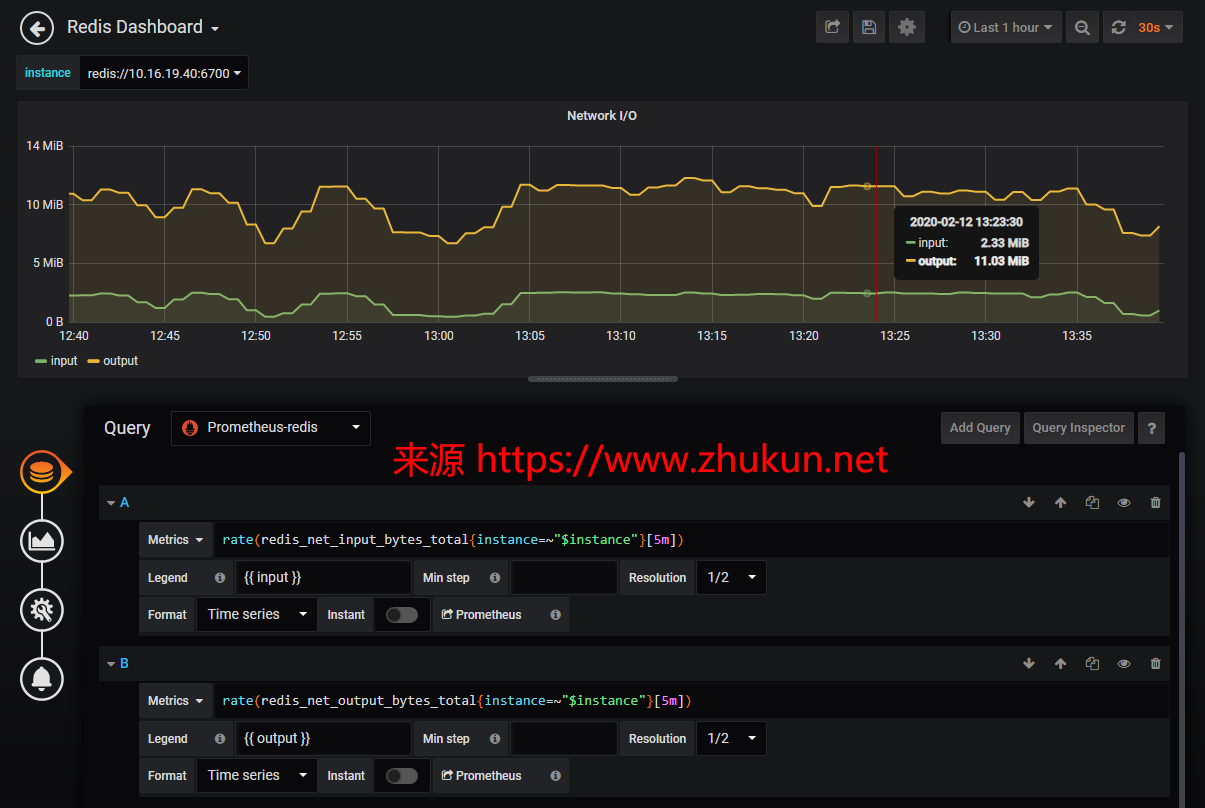
Network I/O(input) 使用Graph面板 rate(redis_net_input_bytes_total{instance=~"$instance"}[5m])
Network I/O(output) 使用Graph面板 rate(redis_net_input_bytes_total{instance=~"$instance"}[5m])
下面是一些详细配置的截图
您好,请教下,我的 redis_exporter version比您的新一些,Memory Usage的百分值出不来,请问是需要在 dashboard的 setting中增加什么 variables么,不知道计算 memory使用百分比的计算公式中 $instance是干啥的,在哪里定义的,谢谢。
label_values(redis_up{env=”BJteam”, service=”engine”}, instance)改为:label_values(redis_up, instance)