Create Worldmap/Table panel in grafana with Elasticsearch datasource
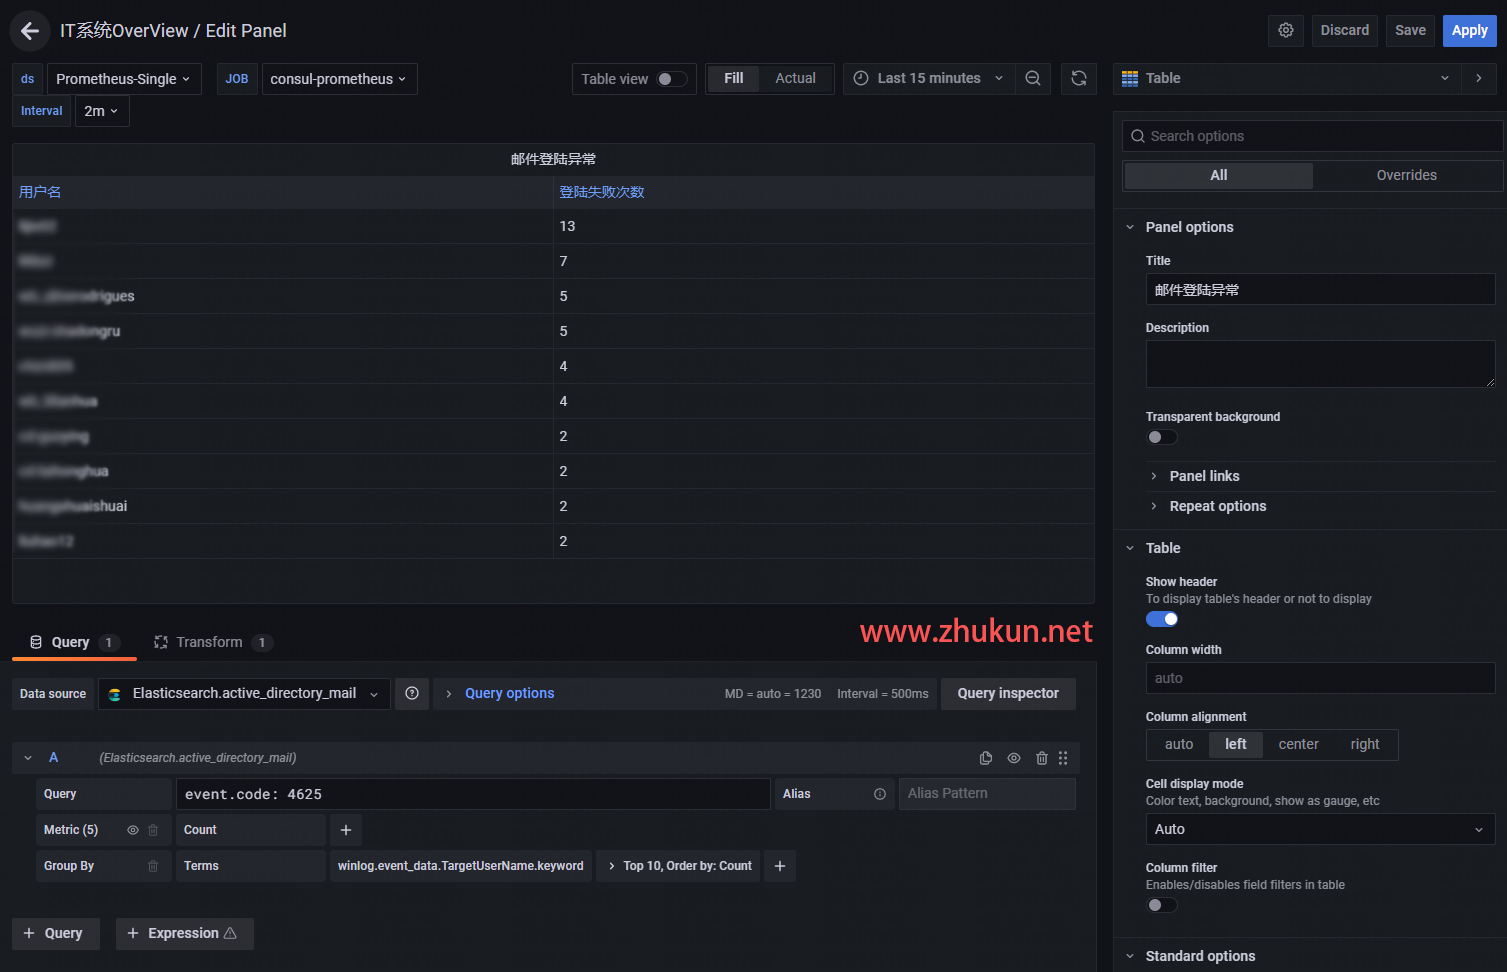
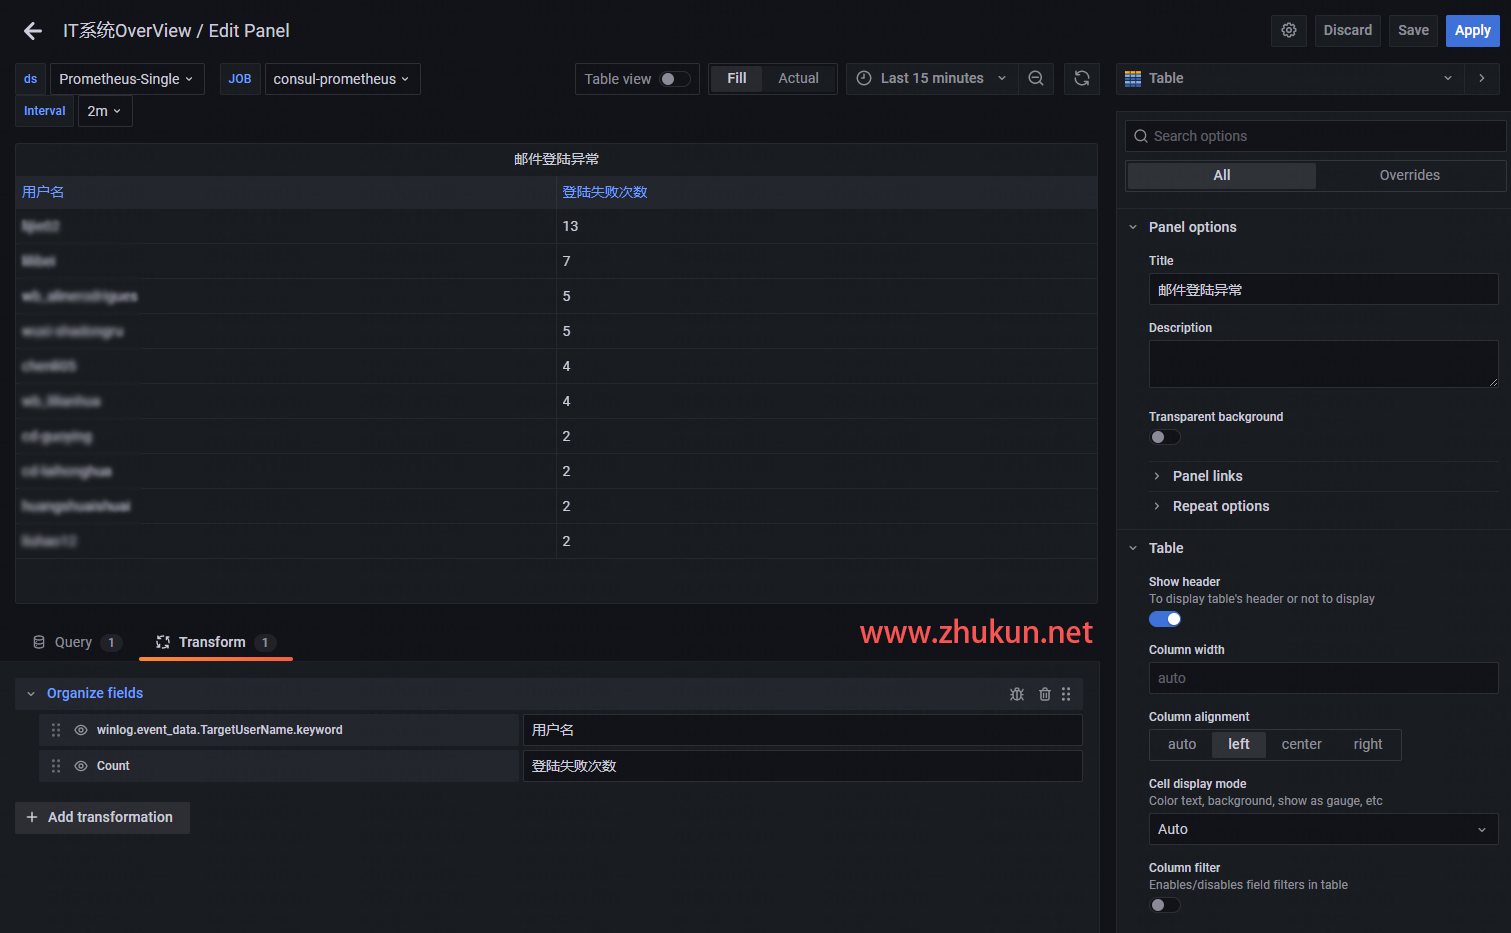
某天接到一个需求, 即在Grafana中添加一个Table panel, 将AD系统里面登陆失败的用户都挑出来, 展示在table里面, 同时也将失败次数展示出来.
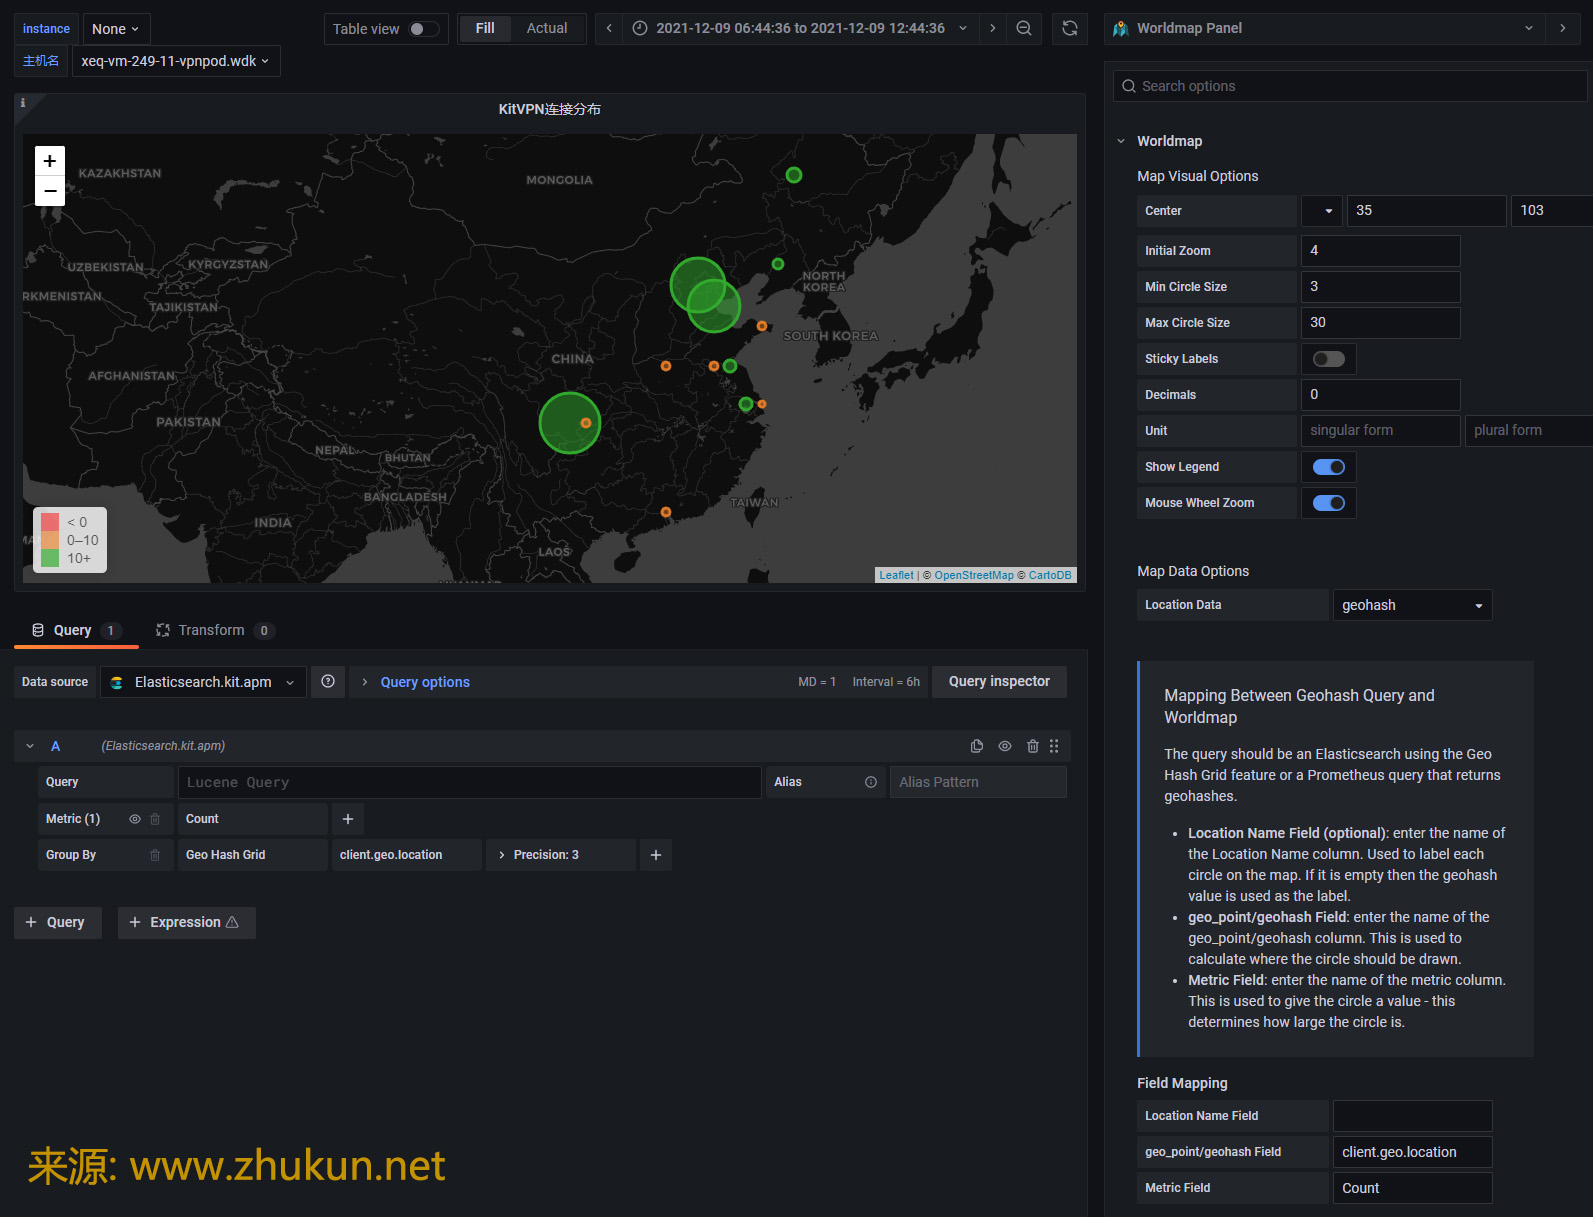
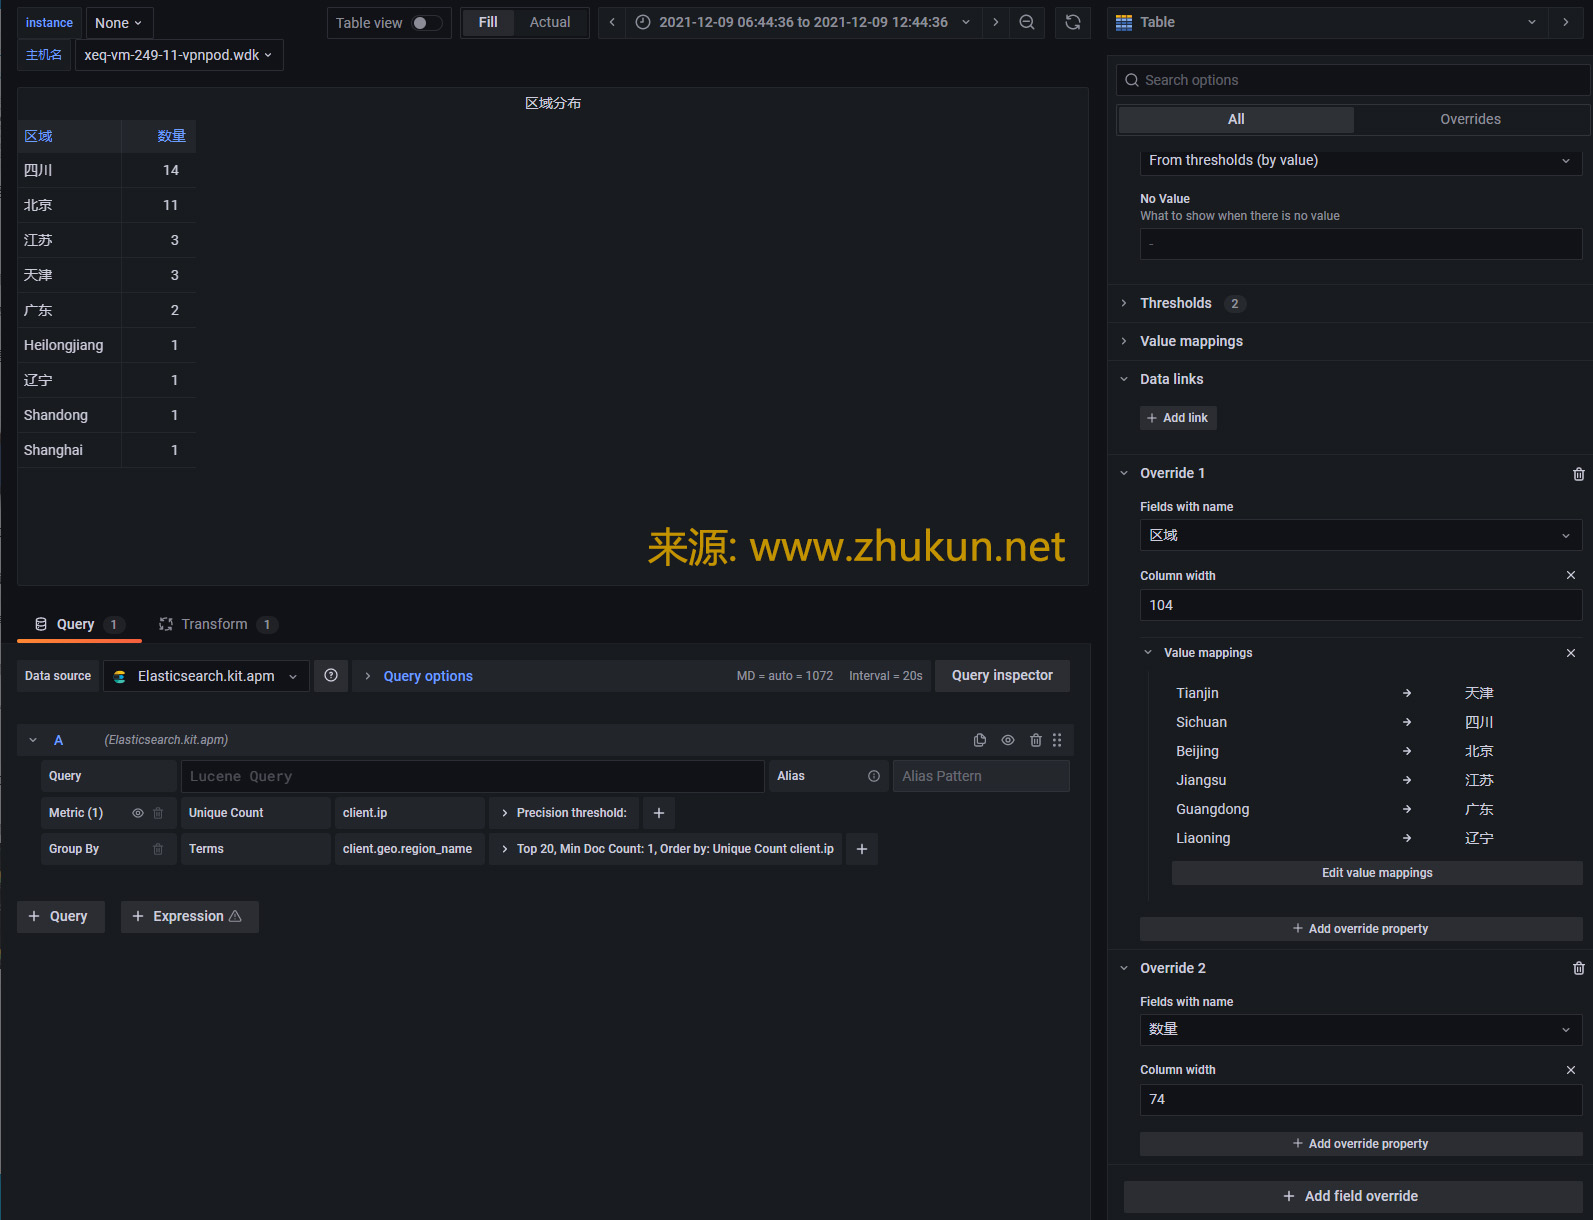
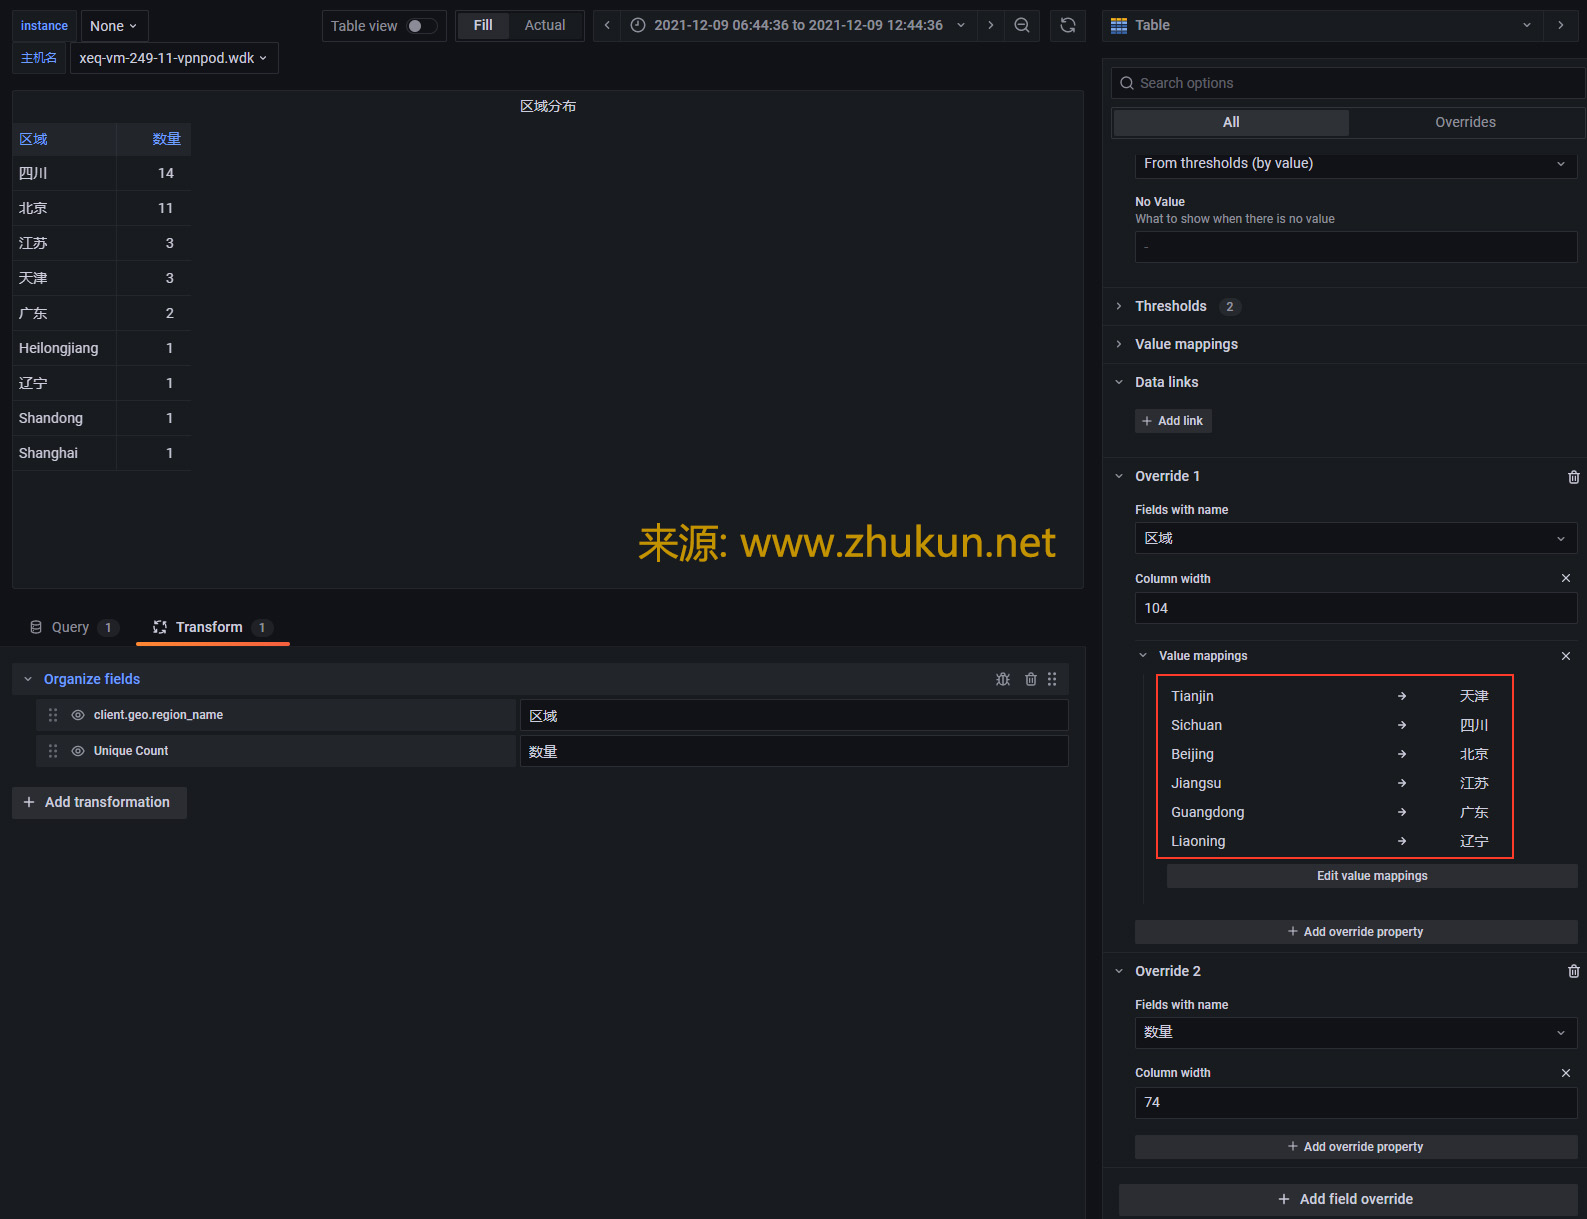
接下来看看Worldmap panel. 新版Grafana的很多设定都发生了变化.
不见去年人, 泪湿春衫袖。
某天接到一个需求, 即在Grafana中添加一个Table panel, 将AD系统里面登陆失败的用户都挑出来, 展示在table里面, 同时也将失败次数展示出来.
接下来看看Worldmap panel. 新版Grafana的很多设定都发生了变化.
1, stop shard allocation for this node
$ curl -XGET "127.0.0.1:9200/_cat/allocation?v"
shards disk.indices disk.used disk.avail disk.total disk.percent host         ip           node
   412      960.3gb     1.8tb     15.6tb     17.4tb           10 172.29.4.156 172.29.4.156 es_node_156_2
   411      478.9gb     1.5tb     15.9tb     17.4tb            8 172.29.4.158 172.29.4.158 es_node_158_2
   411      557.5gb   558.7gb     16.9tb     17.4tb            3 172.29.4.157 172.29.4.157 es_node_157
   411      743.5gb     1.5tb     15.9tb     17.4tb            8 172.29.4.158 172.29.4.158 es_node_158
   411          1tb       1tb      9.9tb     10.9tb            9 172.29.4.177 172.29.4.177 es_node_177
   411      840.6gb     1.8tb     15.6tb     17.4tb           10 172.29.4.156 172.29.4.156 es_node_156
   248        9.3tb     9.3tb      1.5tb     10.9tb           85 172.29.4.178 172.29.4.178 es_node_178
假设我们希望下掉es_node_158_2这个节点, 则下面3条命令任选其一
curl -XPUT 127.0.0.1:9200/_cluster/settings -H 'Content-Type: application/json' -d '{
  "transient" :{
    "cluster.routing.allocation.exclude._ip": "<node_ip_address>"
  }
}'


curl -XPUT 127.0.0.1:9200/_cluster/settings -H 'Content-Type: application/json' -d '{
  "transient" :{
    "cluster.routing.allocation.exclude._name": "es_node_158_2"
  }
}'


curl -XPUT 127.0.0.1:9200/_cluster/settings -H 'Content-Type: application/json' -d '{
  "transient" :{
    "cluster.routing.allocation.exclude._id": "<node_id>"
  }
}'
确认上面的命令执行成功
curl -XGET "127.0.0.1:9200/_cluster/settings?pretty=true"
{
  "persistent" : {
    "cluster" : {
      "max_shards_per_node" : "30000"
    },
    "indices" : {
      "breaker" : {
        "fielddata" : {
          "limit" : "20%"
        }
      }
    },
    "search" : {
      "max_buckets" : "87000"
    },
    "xpack" : {
      "monitoring" : {
        "collection" : {
          "enabled" : "true"
        }
      }
    }
  },
  "transient" : {
    "cluster" : {
      "routing" : {
        "allocation" : {
          "enable" : "all",
          "exclude" : {
            "_name" : "es_node_158_2"
          }
        }
      }
    }
  }
}
然后Elasticsearch会将es_node_158_2节点上的shards分配给其余节点. 再次查看shards allocation情况会发现es_node_158_2上面的shards数量在明显减少.
$ curl -XGET "127.0.0.1:9200/_cat/allocation?v"
shards disk.indices disk.used disk.avail disk.total disk.percent host         ip           node
   248        9.3tb     9.3tb      1.5tb     10.9tb           85 172.29.4.178 172.29.4.178 es_node_178
   438          1tb       1tb      9.9tb     10.9tb            9 172.29.4.177 172.29.4.177 es_node_177
   417      559.9gb   561.1gb     16.9tb     17.4tb            3 172.29.4.157 172.29.4.157 es_node_157
   441      963.1gb     1.8tb     15.6tb     17.4tb           10 172.29.4.156 172.29.4.156 es_node_156_2
   443      842.5gb     1.8tb     15.6tb     17.4tb           10 172.29.4.156 172.29.4.156 es_node_156
   443      747.1gb     1.5tb     15.9tb     17.4tb            8 172.29.4.158 172.29.4.158 es_node_158
   285      472.7gb     1.5tb     15.9tb     17.4tb            8 172.29.4.158 172.29.4.158 es_node_158_2  # shards开始减少
2, stop node and afterwork
等es_node_158_2上面的shards数量变为0的时候, 就可以登陆es_node_158_2并shutdown elasticsearch service了.
在es_node_158_2上面执行
$ systemctl stop elasticsearch
$ systemctl disable elasticsearch
在其它node上面执行
$ curl -XPUT 127.0.0.1:9200/_cluster/settings -H 'Content-Type: application/json' -d '{
  "transient" :{
    "cluster.routing.allocation.exclude._name": null
  }
}'
Read More
本来像聚合(aggregation)这种东西, 在Grafana中可以轻易的实现, 但是偶尔会有需求, 需要自己写DSL脚本实现一些功能, 于是, 只好自己动手了.
查询serverName=”dns-server-1″结果里, 按hostip的数量进行排序, 取前5
GET /my-service-2020.07.22/_search
{
  "query": {
    "term": { "serverName.keyword": "dns-server-1" }
  },
  "size" : 0,
  "aggs": {
    "top-10-hostip": {
      "terms": {
      	"field": "hostip.keyword",
        "size": 5
      }
    }
  }
}
结果 (more…)
Read More关于定期清理ElasticSearch索引, 最简单粗暴的方法是写一个shell脚本, 实现定理删除INDEX. 但其实ElasticSearch官网也提供了一些工具来做这些事, 比如下面2个方法.
$ crontab -l
00 05 * * * /usr/bin/curl -XDELETE localhost:9200/myindex-`date -d "-10days" +\%y\%m\%d`
30 05 * * * /usr/bin/curl -XDELETE localhost:9200/myindex-`date -d "-11days" +\%y\%m\%d`
00 06 * * * /usr/bin/curl -XDELETE localhost:9200/myindex-`date -d "-12days" +\%y\%m\%d`应该是最简单有用的清理INDEX的办法了(官方文档在此, 一个简单的范例在此), 是X-Pack自带的功能, 不需要安装额外工具. ILM的主要功能有
也是ElasticSearch官方的工具, 需要额外安装(下载地址). 这个工具最早是clearESindices.py演化而来的, 最早的目的就是清理删除Index, 再后来, 随着作者被Elasticsearch公司聘用, 这个工具也被更名为Elasticsearch Curator. 它使用yaml作为基础配置语法, 官网提供了一堆Example配置可以参考.
$ cat /etc/elasticsearch/curator-cfg.yml
client:
  hosts:
    - 172.29.4.158
    - 172.29.4.157
    - 172.29.4.156
  port: 9200
  use_ssl: False
  http_auth: "elastic:MyPassword"
  timeout: 30
logging:
  loglevel: INFO
  logformat: default
  logfile: /var/log/elasticsearch/curator.log
$ cat /etc/elasticsearch/curator-del.yml
actions:
1:
action: delete_indices
description: >-
Delete old system indexes.
options:
ignore_empty_list: True
timeout_override:
continue_if_exception: False
disable_action: False
filters:
- filtertype: pattern
kind: prefix
value: .monitoring-kibana-7-
- filtertype: age
source: name
direction: older
timestring: '%Y.%m.%d'
unit: days
unit_count: 3
2:
action: delete_indices
description: >-
Delete old indexes.
options:
ignore_empty_list: True
timeout_override:
continue_if_exception: False
disable_action: False
filters:
- filtertype: pattern
kind: regex
value: '^(office_dns_log-|office_dns_log_failover-|mail-|mail_failover-).*$'
- filtertype: age
source: name
direction: older
timestring: '%Y.%m.%d'
unit: days
unit_count: 180dry-run运行试一下
/usr/bin/curator --config /etc/elasticsearch/curator-cfg.yml --dry-run /etc/elasticsearch/curator-del.yml然后可以观察下/var/log/elasticsearch/curator.log文件里的提示. 确认没问题后, 将–dry-run去掉并写入crontab即可.
参考文档:
Automatically removing index
在Kibana中使用”Stack Monitoring”时, 提示
Access Denied
You are not authorized to access Monitoring. To use Monitoring, you need the privileges granted by both the `kibana_user` and `monitoring_user` roles.
If you are attempting to access a dedicated monitoring cluster, this might be because you are logged in as a user that is not configured on the monitoring cluster.
解决办法: 停用Elasticsearch集群的remote.cluster功能, 将现有remote.cluster全部清除即可.
# 查看现有的 remote cluster
curl -XGET "127.0.0.1:9200/_cluster/settings?pretty"
{
  "persistent" : {
    "cluster" : {
      "remote" : {
        "aaa" : {
          "skip_unavailable" : "true",
          "seeds" : [
            "172.29.4.168:9300"
          ]
        },
        "leader" : {
          "seeds" : [
            "172.29.4.168:9300"
          ]
        },
        "hello-elk" : {
          "skip_unavailable" : "false",
          "seeds" : [
            "127.0.0.1:9300"
          ]
        }
      }
    },
    "xpack" : {
      "monitoring" : {
        "collection" : {
          "enabled" : "true"
        }
      }
    }
  },
  "transient" : { }
}

# 清除其中一个 remote cluster 节点
curl -X PUT "127.0.0.1:9200/_cluster/settings" -H 'Content-Type: application/json' -d'{
  "persistent" : {
    "cluster" : {
      "remote" : {
        "leader" : {
          "seeds" : null
        }
      }
    }
  }
}'
提示: 如果一个remote cluster节点设置了”skip_unavailable” : “true”信息, 直接清除可能会提示Cannot configure setting [cluster.remote.hello-elk.skip_unavailable] if remote cluster is not enabled. 解决办法为, 先将skip_unavailable设置为null, 再将seeds设置为null
Read More迁移ElasticSearch集群的数据, 最好用的是用到ElasticSearch的CCR(Cross-cluster replication, 跨集群复制)功能(官方文档在此). 但无奈今天配置了一天, 怎么也没有成功. 其实CCR存在的意义不仅仅是迁移数据, 更重要的是保证ElasticSearch集群的多副本/高可用状态. 比如, 如果你的主ES集群不能对外暴露, 那么可以设置一个readonly的对外暴露集群(数据通过CCR功能与主集群保持同步, 等. 而如果仅仅是迁移数据的话, 只用到ES的reindex功能即可完成.
将旧集群(172.29.4.168:9200)里的mail-w3svc1-2020.06.06索引数据迁移过来, 仅需要在新集群上执行如下命令即可.
curl -X POST "localhost:9200/_reindex?pretty" -H 'Content-Type: application/json' -d'
{
  "source": {
    "remote": {
      "host": "http://172.29.4.168:9200",
      "username": "elastic",
      "password": "MyPassword"
    },
    "index": "mail-w3svc1-2020.06.06"
  },
  "dest": {
    "index": "mail-2020.06.06"
  }
}'
参考文档:
Reindex API
ElasticSearch中的Index一旦建立, 里面的Field类型就不可以再更改. 例如, 你不能把一个int类型的字段, 改为string类型. 否则该字段中的数据将失效. 那么如何解决这个问题呢? 答案就是重新建立索引(Reindex).
本文演示一下如何将以下旧的index中的数据以零停机的方式迁移到新的Index中.
旧Index: mail-w3svc1-2020.06.09
新Index: mail-w3svc1-2020.06.09-v2
curl -XPUT 127.0.0.1:9200/_template/mail-test -H 'Content-Type: application/json' -d'{
  "index_patterns": ["mail-w3svc1-2020.06.09-v2"],
  "settings" : {
    "index.refresh_interval": "10s",
    "number_of_shards": 1,
    "number_of_replicas": 0,
    "index.translog.durability": "request",
    "index.translog.sync_interval": "30s"
  },
  "mappings": {
    "properties": {
      "rt": { "type": "integer" },
      "status": { "type": "integer" },
      "sub_status": { "type": "integer" }
    }
},
  "order" : 5
}'
curl -XPUT 127.0.0.1:9200/mail-w3svc1-2020.06.09-v2

# 查看之
curl -XGET 127.0.0.1:9200/mail-w3svc1-2020.06.09-v2?pretty=true
curl -XPOST localhost:9200/_aliases -H 'Content-Type: application/json' -d '{
  "actions": [
    { "add": { "index": "mail-w3svc1-2020.06.09", "alias": "mail-w3svc1-2020.06.09-alt" } }
  ]
}'
Read More